COVID-19 Modeling: How Many Coronavirus Deaths by the End of Summer?
Benchmarks for determining accuracy of projections are set.

"All models are wrong, but some are useful" is an aphorism attributed to statistician George Box. It certainly applies to people's attempt to model the COVID-19 outbreak.
Fortunately, some of the more dire predictions of how the COVID-19 pandemic could play out—80 percent of Americans infected, with 2.2 million deaths over the next couple of years—have proven wrong so far. Now that it's been four months since the first COVID-19 cases in Wuhan, China, were described, what do current models foresee for the immediate course of pandemic for the United States?
You may recall that on March 31, the administration's coronavirus task force coordinator—Deborah Birx—cited unspecified modeling results that suggested that between 100,000 and 240,000 Americans could die of the disease in the coming months.
On March 26, the University of Washington's Institute for Health Metrics and Evaluation (IHME) reported its model's initial projections. Assuming that social distancing and lockdowns basically remained in force until May, the IHME's central estimate was around 81,000 Americans (with a 95 percent chance that the number of deaths would range between 38,000 to 162,000) would die over the following four months.
As the IHME researchers fine-tuned their model's statistical elements, making adjustments to account for policy changes and evolving data, their estimates for American COVID-19 deaths have fluctuated over the past month. For example, the IHME model on April 1 raised its estimates for American COVID-19 deaths to nearly 94,000 (a range of 41,000 to 177,000); on April 17, it lowered them to just over 60,000 (a range of 34,000 to 140,000). On April 1, the IHME modelers predicted that daily deaths would peak at 2,214 on April 15. In their latest report, the IHME researchers now project total U.S. COVID-19 deaths will reach 72,500 (a range of 59,000 to 114,000) by August.
As an example of the perils of epidemiological forecasting, consider the projections a Rutgers statistician published on April 25 in the journal Reliability and Statistical Learning and Its Applications. Based April 14 model calculations, the statistician predicted that "the maximum total number of deaths will be approximately 62,100 across the United States due to the Covid-19 virus."
A team led by Dan Nicolau, a mathematician and physician at the Queensland University of Technology (QUT), has developed a model that bases its predictions on how cases, recoveries, and deaths of COVID-19 rise and fall in various countries. Through parsing such data, they claim to have identified a relationship between confirmed cases and recovered patients that predicts when the epidemic will peak and how many deaths will result from the disease in individual countries.
Basically, when the difference between the number of cases and number of recovered patients peaks, their model expects the number of deaths in each country to peak about 25 days later. The team's "broad predictions for the number of fatalities" are "generally somewhat lower than most other models." Their data and projections are available at COVIDwave.org.
These researchers suggest that when the ratio of the number of new to recovered cases reaches 2 to 5—the green band in chart below—the first pandemic wave has passed:

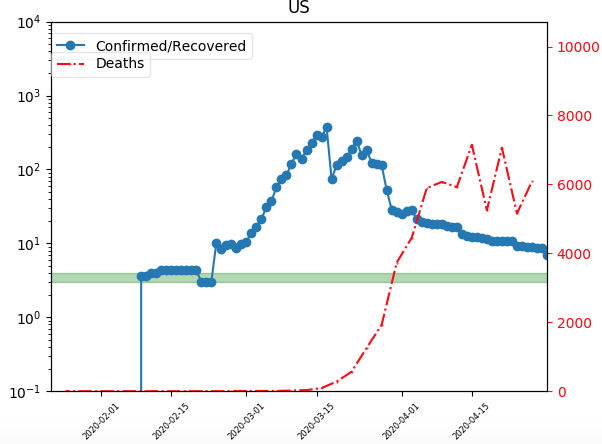
According to the QUT model, the U.S. is headed in the right direction but has not yet reached the resolution stage of the epidemic. In their April 14 preprint, the researchers estimated that the first wave of the epidemic would result in around 50,000 U.S. COVID-19 deaths and about 250,000 for the world. In April 24, they upped their number of projected U.S. first-wave deaths to 75,000.
The independent researcher Youyang Gu and his team have devised a COVID-19 epidemic prediction model by applying machine learning techniques to parse such data as how many people get the virus from each infected person, the length of the infectious period, and the time to recovery. This model's projections are considerably less optimistic than the ones we get from the IHME and QUT models. The central estimate is that total U.S. COVID-19 deaths will reach 170,000 (a range of 98,000 to 293,000) by the beginning of August.
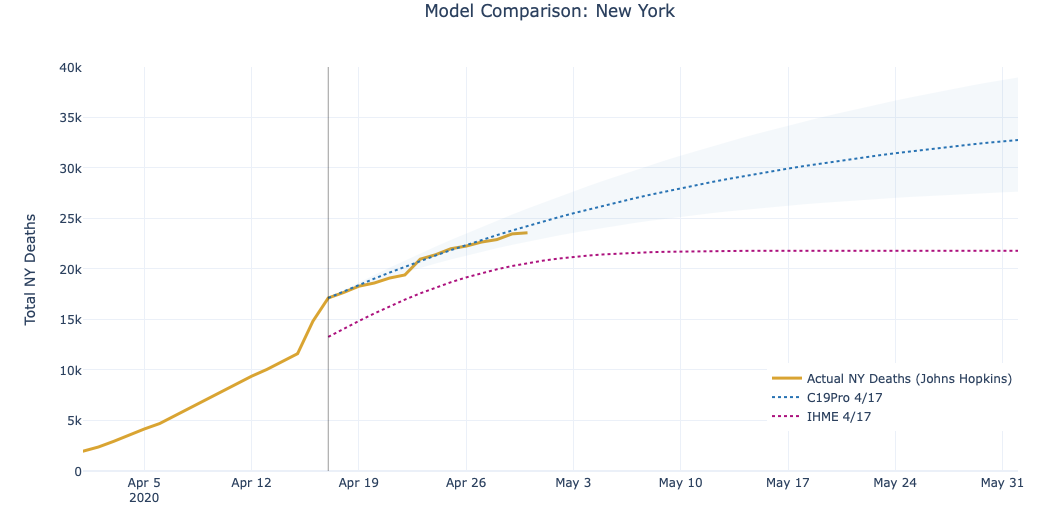
Gu and his colleagues compare their model's projections with those made by the IHME model in early April for various states, including New York and Michigan:


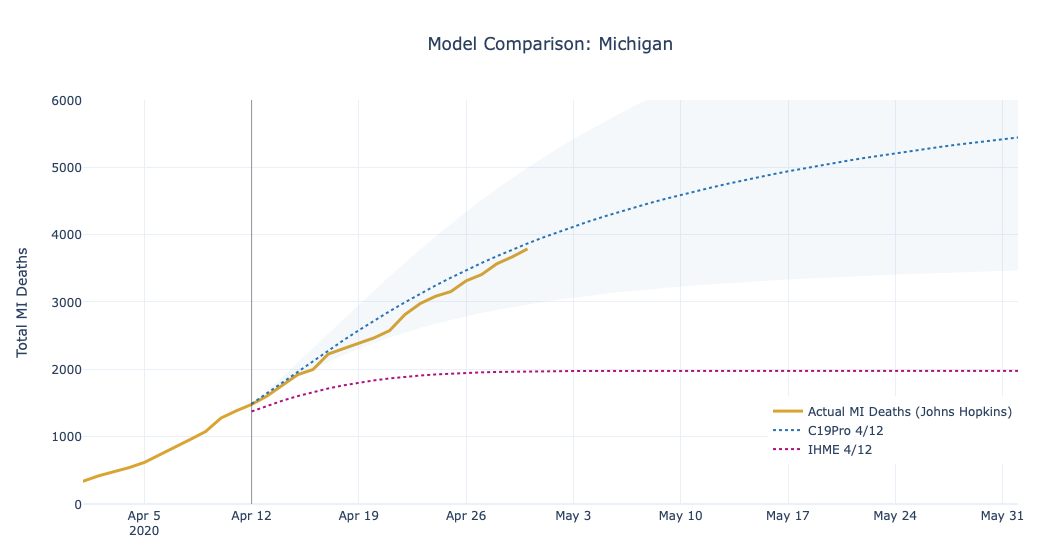
They also make some rather bold benchmark predictions for additional U.S. COVID-19 deaths per week in the coming month.

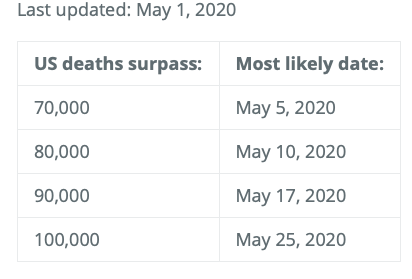
Such specific predictions make it easy for public health officials, politicians, and the public to track the model's accuracy. The model makes specific predictions for how the disease will likely progress for each state as well.
Interestingly, Gu and his colleagues also report that their model "determined that the true mortality rate for COVID-19 in most regions in the world is less than 1%. This is again consistent with what scientists have found, despite the fact that the official mortality rate is much higher (e.g. Italy is at 13-14%)."
So let's review the state of play among the models considered here. As of today, about 65,000 Americans have died of COVID-19. Two weeks ago, the Rutgers model predicted a maximum of 62,100 U.S. deaths by the end of the summer. The most recent IHME estimate is 72,500 (a range of 59,000 to 114,000) by August. The QUT model's updated projection is 75,000 by August. And finally, the Gu team's model is predicting 170,000 (a range of 98,000 to 293,000) by the beginning of August.
Yesterday, 2,097 Americans lost their lives to COVID-19. The IHME model had projected a central estimate of 1,266 deaths for that date. The central estimate for the Gu model was 2,029.
Looking further forward, the IHME model projects that U.S. COVID-19 deaths per day will have fallen to 275 (a range of 14 to 1,262) by May 15, and to 44 (a range of 0 to 220) by June 1. Gu's model also projects falling daily COVID-19 deaths, but not at nearly as fast a rate. On May 15, it says daily deaths will be 1,456 (a range of 782 to 2,274), dropping only to 1,129 (a range of 380 to 2,103) on June 1.
These projections make significant assumptions about the effectiveness of various public health measures in determining the course of the epidemic. Change those policies, and their projections will necessarily diverge from the ones they provide now.
The upshot is that it would be comparatively good news if two weeks from now the daily U.S. COVID-19 death rate hews to the IHME's projections and is only about a fifth of the Gu model's central projection. By then, we will know a bit more about these models' usefulness.
Editor's Note: As of February 29, 2024, commenting privileges on reason.com posts are limited to Reason Plus subscribers. Past commenters are grandfathered in for a temporary period. Subscribe here to preserve your ability to comment. Your Reason Plus subscription also gives you an ad-free version of reason.com, along with full access to the digital edition and archives of Reason magazine. We request that comments be civil and on-topic. We do not moderate or assume any responsibility for comments, which are owned by the readers who post them. Comments do not represent the views of reason.com or Reason Foundation. We reserve the right to delete any comment and ban commenters for any reason at any time. Comments may only be edited within 5 minutes of posting. Report abuses.
Please
to post comments
COVID-19 Modeling: How Many Coronavirus Deaths by the End of Summer?
Are we starting a pool? What does the winner get?
Travel papers.
Change Your Life Right Now! Work From Comfort Of Your Home And Receive Your First Paycheck Within A Week. No Experience Needed, No Boss Over Your Shoulder... Say Goodbye To Your Old Job! Limited Number Of Spots Open...
Find out how HERE......More here
Winner gets to be far more correct than any model.
Why the fuck are we still looking at the models?
Their curves!!
I prefer curvier models, but everyone else wants to flatten the models' curves.
Free one way ticket to a hot-spot in Iran.
The model was useful to scare people into giving power to the government back in March.
No 'adjusting' the models now, it was the bad March modeling that crashed the economy. The so called experts have to pay with at least their jobs.
True enough. Fausi would be long gone by now.
But government doctors keep their jobs no matter how wrong they are.
Why is Congress still getting paid?
" 81,000 Americans (with a 95 percent chance that the number of deaths would range between 38,000 to 162,000)"
That seems like a really wide confidence interval; granted, it's been 10 or 15 years since I've taken a statistics class. Is this fairly typical of these kind of models?
Been awhile since my stochastics days, but yes - 95% chance means they're going out several standard deviations. All that's left are the fringes of the bell curve.
Huh, seems the model might be pretty accurate, but very imprecise. With such a low confidence of precision, it's hard not to question the prudence of basing policy decisions on them.
(I can't remember if I'm using any of those terms correctly; it's possible I'm an idiot here.)
You're mixing accuracy with precision. A bad model will get a bad answer, but always group around that bad answer.
I'll meet ya halfway and say we're both wrong
Not really that accurate.
95% (two sigma, or “four sigma” if you consider errors on both sides of the bell curve) is the highest margin of error any “scientist” can cite without losing much credibility. It's only +/- two standard deviations, pretty rough. But it's convincing enough that non-STEM people go ooh-aah.
Ref the private sector’s six sigma standard (99%) for a far more stringent approach.
six sigma is a physics standard, and it's a lot more sure than 99%. Six sigma is the requirement for stuff like 'proving a new particle exists'.
99% is just 3 sigmas. You don't double sigmas just because you look at both sides of the bell curve - that it's two-tailed is implicit in the fact that you're looking at a normal distribution. A one-tailed distribution is literally a different distribution and not a normal distribution at all.
Bullshit models often try to encompass all possible answers.
That is the #1 flaw I hit our Data Scientists with at my job. They develop a model, and then try to explain too much with it.
My model predicted between 0 and 330000000 COVID-19 deaths in the US all the way back in early February. I should have published it, I'd be famous now.
Yep, 95% (two sigma, or "four sigma" if you consider errors on both sides of the bell curve) is the highest margin of error any "scientist" can cite without losing much credibility. Ref the private sector's six sigma standard (99%) for a far more stringent approach.
Oh Ron's pimping again.
375,000 dead by the end of August, if we count anyone that dies within 100 square miles of a confirmed case as having died of COVID-19.
Deaths are so low because we are being to stringent with our definitions of "confirmed" and "probable" cases.
I put my guess at around 300k by the end of the year. This was an early guess and it isn't looking likely unless we have a massive resurgence in the fall. I'm curious who will be more accurate, the experts and their models or my raw guess based on an estimate of our elderly population
As of today, about 65,000 Americans have died of COVID-19.
Stating facts not in evidence.
I'll go with 'probably way less than whatever they say'.
The accuracy of projections depends upon the accuracy of the information input. For instance if the number of deaths are increased that will throw off the projection of death to be expected. In this case I expect that many deaths that have been caused by COVID-19 could be caused by other causes. But these deaths will affect projection the number of people that will die.
There will be years of sifting the data and refining what these models should have projected.
But who is dying? If it's 75% people over 65 with comorbidities should we react the same as we would if it was 20 year old healthy people?
"We're not to that level of fine-tuning. Yet."
Not enough to justify fascism.
Amen.
I'm about at the point of rooting for the virus..
When did you become a Democrat?
-jcr
Thanks, Ron. Please stay on the, um, case.
Mr. Bailey....Much better. My only suggestion is using a table format when you are comparing model results (your last few paragraphs. I think a table would have added clarity.
I'll stick with the lower numbers. But whatever, they will spin the final data anyway. Got to justify this lockdown statism somehow.
On a side note, you should read the whiny ass bitch Will Wheaton's writeup at Kos. It is by far one of the funniest prog fag tantrums I have seen. Since he's done blaming his parents for his failed life, he's back on his Cheeto Hitler kick. Must be the meds.
Modeling got us where we are now. It is not modeling, it is guesswork, nothing else. Modeling will now throw us into, at best, a deeper recession than 2008 or possibly a depression. Screw your modeling. And you call your website "Reason?"
Well since they keep changing the definition of what gets counted as a Covid 19 death, it makes it hard for models to be correct.
Exactly. From what I understand, a person testing positive for the virus could be run over by a bus, yet their death is attributed to the virus.
Maybe I’m just too stupid, but it seems like there is a significant difference between dying “with” the virus (the official counts) and dying “of/from” the virus.
And we're already a step past that. Now it's "if he died of something that looks like corona". Keep in mind that corona has very common symptoms, and even people who were sick enough to get tests had something OTHER than corona roughly 80% of the time. They're lumping everything into the covid bucket they can. That means ANYBODY who tested positive, and anybody who had covid symptoms. Madness.
So which model is the CDC trying to match by loosening the definition of a death from CV to a CV-related death?
Whichever one gets them out of having to admit they were fucking wrong.
Still thinking close to zero.
Since the numbers have been deliberately --and openly-- obfuscated I can't see how I could be wrong.
I think that, as with the basic cold, there are people who get it that die from comorbidities(when did this hideous word replace 'pre-existing conditions'?), there are people who get it that die from pneumonia, and there are people who get it that die from opportunistic infections.
I don't think ANYONE is dying just from COVID-19.
But we live in the time of narrative-as-news, when every death that the media can lay claim to becomes a death from COVID-19 no matter how ludicrous it appears. And people just accept and scream for longer lockdowns.
You need to visit an ICU. That would shut your ignorant mouth.
Why?
Would I see people on ventilators? Suffering from pneumonia brought on by COVID-19?
Perhaps the ignorant mouth that needs shutting is yours, the one that doesn't seem able to understand how these things work.
You prattle on, barely understanding your previous word, never mind what's going on, spreading panic and ignorance and have the audacity to think that YOU'RE the smart one.
We all sit here arguing over whether the death rate is going to be .1 or .3 or .5% and bemoaning the horror of it--while studiously ignoring the fact that over 99% of people are NOT going to die from it.
Right now, as you freak out, the number of confirmed cases in the US is STILL less than one third of one percent of the population.
And that's the AGGREGATE. Get that? The AGGREGATE. That means that, right now, the number of people in the US who actually HAVE the virus is much less than that.
So please, if you have nothing intelligent to add, don't tell the people that do to shut up.
Ponder how many doctors write *COVID* as cause of death, knowing that this will be accepted as-is by the surviving family, as opposed to writing kidney failure, heart attack or something else where the family might sue, claiming malpractice.
Well, my prediction is less than ~150k deaths actually caused by covid-19 (ie, no worse than on par with the '68 flu pandemic, adjusted for population growth). Assuming we can convince people to stop counting 'overdosed on drugs but had a positive covid-19 test' and 'hit by a bus but had a positive covid-19 test' as covid-19 deaths.
Also, most of those deaths won't be statistically excess deaths. No more than 50k statistically excess deaths.
Look at the data. We are just past the maximum. But the tail is longer and less steep than the rise in pandemics. By August we will have 140-150k corpses, but still burying about 50 per day.
Even a broken clock is right twice a day. These models and predictions have been all over the place from 60,000 to 2.2 million deaths in the US. I think it is mostly a guessing game and after having two months to consider the rate of infections they should be close by now. The daily number are skewed by slow reporting. Even in some states the daily count will suddenly rise when nursing homes or prisons suddenly report a weeks worth of data. The good thing is it is declining and people are beginning to awaken to the idea this has been overblown. It seems this was a political ploy by the Democrats attempting once again to affect the November election and gain political power. They were damning President Trump for not doing enough and now are damning him for the effect on the economy after insisting he take drastic measures. There Monday morning quarterbacking is getting ridiculous with the hysterical should have could haves.
Someone remind me... How much tax money does an American hospital get for each COVID-19 case, and what are the modifiers for whether they get intubated or they die?
I know I've seen an article mentioning this in the last week or so.
-jcr
This obsession with covid deaths, with all the economic and political incentives to manipulate the total, is probably misplaced. The mortality number that really matters is excess deaths beyond how many people would die anyway. We can only guess, but it’s pretty easy to count weekly or monthly death reports from the last few years to get a no-pandemic baseline.
That information is published by the CDC. You can see it here: https://www.cdc.gov/nchs/nvss/vsrr/covid19/index.htm
Note: this data likely is going to grow over the next few weeks as death certificates come in. We can see that up until April 11th the number of excess deaths significantly exceeds the number of covid 19 deaths.