Take a minute from sequester panic - it's just like Sophie's Choice, but with cheetahs! - to think about an even more profound scam emanating from Washington, D.C.: the ridiculous revenue projections that politicians of both parties are banking on to forestall the sort of serious changes to government spending.
You'll note something funny about the blue bars: They never go down. If that happens, it will be the first time is post-World War II history that real federal revenues have had such a sustained rally.
Mercatus.org
If current law remains unchanged, the CBO estimates…tax collection is projected to double from its 2012 levels to reach $4,961 billion by 2023. This is overly optimistic.
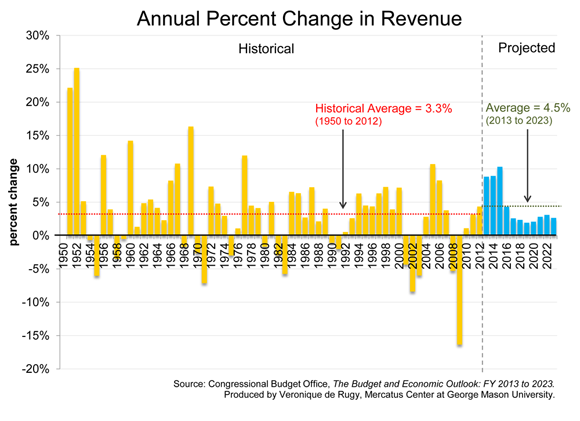
In a companion chart, de Rugy maps the annual percent change in revenue from 1950 through 2023 (the last year covered by the CBO's report). Between 1950 and 2012, the average percent change in revenue was 3.3 percent. For the period between 2013 and 2023, using current law and various rosy scenarios provided by the government, the CBO expects average year-over-year percentage growth to be 4.5 percent.
Editor's Note: As of February 29, 2024, commenting privileges on reason.com
posts are limited to Reason Plus subscribers. Past commenters are grandfathered in for a temporary
period.
Subscribe
here to preserve your ability to comment. Your
Reason Plus subscription also gives you an ad-free version of reason.com, along with full access to the
digital
edition and archives of Reason magazine. We request that comments be civil and on-topic. We do
not moderate or assume any responsibility for comments, which are owned by the readers who post them. Comments
do not represent the views of reason.com or Reason Foundation. We reserve the right to delete any comment and
ban commenters for any reason at any time. Comments may only be edited within 5 minutes of posting. Report abuses.
Make the CBO a cushy job, with good pay and generous benefits, but with the lifelong understanding that if your projections are off by a agreed upon amount in agreed upon time period, you go to jail for life.
This reminds me of every acquisition proposal I ever got involved with. CEO would ask us to project 4% growth every year for five years (because we'd do so much better at expanding the acquiree than they had!) Just about every acquisition would then look good.
But we'd always run a level growth, too, and that stopped about 2/3 of the deals or got us to lower our offer price. I have to believe
China is right now drastically lowering the offer price for the U.S.
You know we would be so much better off with high taxes and no regulation. That's the real killer. You can be the vig, but spending hours that you could be being productive on bureaucratic bullshit is what's really strangling the economy.
Dear Nick - you really should either a) take a look at the % change chart or b) regraph on semi-log paper. While the absolute growth in the first couple years is very optimistic/unrealistic, the later years do not appear to be out of line.
Even if they run a monte carlo simulation (which they probably do), the end result will not necessarily show a negative year as the average (ie, expectation value) is that the growth will be positive - and that same would hold true for just about any ten year period on the historical graph too. You seem to want them to predict the starts and ends of recessions in the 10 year plan - yet how many people can actually acurately predict even next year?
Actually you are wrong, just taking the small graph displayed in the article, laying a pen over the slope of the years from 1950 - 1995 shows that today revenues are right about where they should be do there is no real reason to expect that the growth rate from 1995 - 2013 should have been significantly higher than the very stable earlier period. Nor is there reason to expect future growth to increase faster than it has in the past yet the slope of revenue increases from 2013 - 2022 is noticibly steeper than the historical average.
In fact there is every reason to expect that government revenues will begin to decline soon because with the baby boomers retiring the percentage of the population who is working age will begin to dwindle, a smaller working population means a smaller tax base and that will hold revenue growth down even if you assume unprecidented productivity gains continuing unabated.
Realistically any projection which assumes 2022 Federal Revenues more than $3.75 trillion in inflation adjusted (2010) dollars (Probably around $4.5 trillion nominal dollars) is unrealistically optimistic
Please put the data on a semi-log chart before talking about slopes. Any positive, non-linear time series will look to grow exponentially when presented as y vs x.
And as someone below re-iterates, the reason their overall % is higher is because of the first couple of years of the projection, which I did note was probably very unrealistic.
As to your comments re tax base, that argument is dubious. The US pop increased by 27 million in the last decade, growth in under 5 was very strong. Remember that replacements are coming in on a larger base than 1960. Factor in inflation and it is not unrealistic to assume a continued increase in nominal revenue.
Did you read either my post or the original article?
That chart is in inflation adjusted terms, not nominal dollars, the Chart does not say that revenue will be $4.75 Trillion in 2022, it says it will be $4.75 in 2010 dollars, in nominal dollars that would be somewhere around $6 trillion in nominal dollars.
Finally I did not say that the total count of working age Americans would decrease, I said the percentage of Americans who were working age would. That said while the absolute count will increase for the forseeable future, the Census Bureau estimates about 1 million a year new working age Americans over the next 50 years, in the last 50 years the number of Working age Americans has grown from 106 to 203 million, growing at 2x the rate as it is projected to in the future.
Since the primary drivers of GDP growth (and therefore Tax Revenue growth) are Population Growth, Productivity gains, and Inflation and we have already factored inflation out of the equation that means that just to match the economic growth rates of the past productivity would need to increase 2x as fast as it historically has just to keep the same rates
That's kind of a nitpick. The explosive growth in the first couple of years is the problem, which contaminates the later years too; they're projecting normal expansion on a previous rosy estimate.
What they're predicting is that after 4-5 years of completely failing to have rapid catch up growth to "potential GDP," we'll suddenly achieve it. That reality has failed to conform to their preferred economic theory so far in this recovery doesn't keep them from saying that it'll happen soon, any day now.
That's the same CBO that predicted in 2010 that the 2013 deficit would be just 3% of GDP.
http://www.econbrowser.com/arc....._egtr.html
Buncha morons.
Make the CBO a cushy job, with good pay and generous benefits, but with the lifelong understanding that if your projections are off by a agreed upon amount in agreed upon time period, you go to jail for life.
All ok, except the life in prison part. How about crucifixion instead?
We have to make the deal just sweet enough so that idiots will take it.
This reminds me of every acquisition proposal I ever got involved with. CEO would ask us to project 4% growth every year for five years (because we'd do so much better at expanding the acquiree than they had!) Just about every acquisition would then look good.
But we'd always run a level growth, too, and that stopped about 2/3 of the deals or got us to lower our offer price. I have to believe
China is right now drastically lowering the offer price for the U.S.
It's perfectly reasonable to continue the trend from late 90s dotcom and mid 00s real estate booms without accounting for their epic busts.
Yep.
You know we would be so much better off with high taxes and no regulation. That's the real killer. You can be the vig, but spending hours that you could be being productive on bureaucratic bullshit is what's really strangling the economy.
Should be "You can pay the vig"
Dear Nick - you really should either a) take a look at the % change chart or b) regraph on semi-log paper. While the absolute growth in the first couple years is very optimistic/unrealistic, the later years do not appear to be out of line.
Even if they run a monte carlo simulation (which they probably do), the end result will not necessarily show a negative year as the average (ie, expectation value) is that the growth will be positive - and that same would hold true for just about any ten year period on the historical graph too. You seem to want them to predict the starts and ends of recessions in the 10 year plan - yet how many people can actually acurately predict even next year?
Actually you are wrong, just taking the small graph displayed in the article, laying a pen over the slope of the years from 1950 - 1995 shows that today revenues are right about where they should be do there is no real reason to expect that the growth rate from 1995 - 2013 should have been significantly higher than the very stable earlier period. Nor is there reason to expect future growth to increase faster than it has in the past yet the slope of revenue increases from 2013 - 2022 is noticibly steeper than the historical average.
In fact there is every reason to expect that government revenues will begin to decline soon because with the baby boomers retiring the percentage of the population who is working age will begin to dwindle, a smaller working population means a smaller tax base and that will hold revenue growth down even if you assume unprecidented productivity gains continuing unabated.
Realistically any projection which assumes 2022 Federal Revenues more than $3.75 trillion in inflation adjusted (2010) dollars (Probably around $4.5 trillion nominal dollars) is unrealistically optimistic
Please put the data on a semi-log chart before talking about slopes. Any positive, non-linear time series will look to grow exponentially when presented as y vs x.
And as someone below re-iterates, the reason their overall % is higher is because of the first couple of years of the projection, which I did note was probably very unrealistic.
As to your comments re tax base, that argument is dubious. The US pop increased by 27 million in the last decade, growth in under 5 was very strong. Remember that replacements are coming in on a larger base than 1960. Factor in inflation and it is not unrealistic to assume a continued increase in nominal revenue.
Did you read either my post or the original article?
That chart is in inflation adjusted terms, not nominal dollars, the Chart does not say that revenue will be $4.75 Trillion in 2022, it says it will be $4.75 in 2010 dollars, in nominal dollars that would be somewhere around $6 trillion in nominal dollars.
Finally I did not say that the total count of working age Americans would decrease, I said the percentage of Americans who were working age would. That said while the absolute count will increase for the forseeable future, the Census Bureau estimates about 1 million a year new working age Americans over the next 50 years, in the last 50 years the number of Working age Americans has grown from 106 to 203 million, growing at 2x the rate as it is projected to in the future.
Since the primary drivers of GDP growth (and therefore Tax Revenue growth) are Population Growth, Productivity gains, and Inflation and we have already factored inflation out of the equation that means that just to match the economic growth rates of the past productivity would need to increase 2x as fast as it historically has just to keep the same rates
That's kind of a nitpick. The explosive growth in the first couple of years is the problem, which contaminates the later years too; they're projecting normal expansion on a previous rosy estimate.
What they're predicting is that after 4-5 years of completely failing to have rapid catch up growth to "potential GDP," we'll suddenly achieve it. That reality has failed to conform to their preferred economic theory so far in this recovery doesn't keep them from saying that it'll happen soon, any day now.
And we all know that a government needs $5 trillion to operate effectively.
Give 'em $5 trillion and they'll only need $10 trillion to operate effectively. Give 'em $10 T and they'll need $20 T and they'll need $50 T...
The chart tells me to BUY GOLD