Government Assault on the Chinatown Bus Industry Fueled By Bogus Federal Study
An influential report by the National Transportation Safety Board used the wrong data and committed "statistical malpractice."

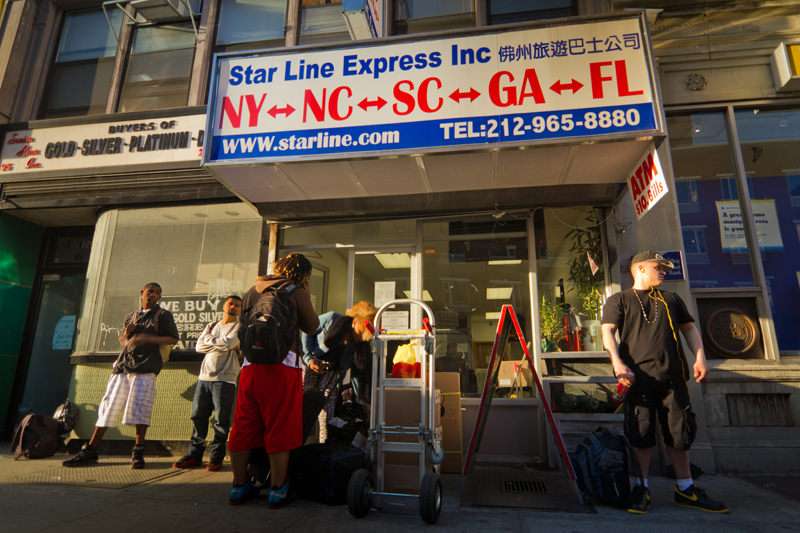
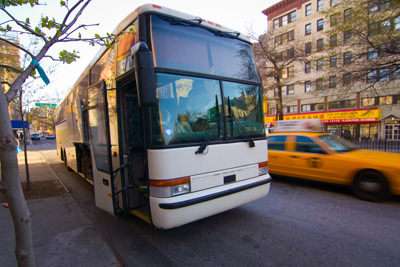
In 1997, Chinese-born entrepreneurs began regularly scheduled long-distance bus services that picked up passengers on the street. Tickets were priced so low that it was hard to figure how the operators could be breaking even, much less making a profit. Faced with declining market share, Greyhound and Peter Pan imitated the Chinatown model by teaming up to create a new venture called BoltBus. Then Coach USA got into the game with Megabus. Today, "curbside" buses—lines that begin and end their routes at the sidewalk as opposed to a traditional station—make up the fastest growing form of intercity travel in the U.S.
But over the past two years, the government has forced 27 bus companies based in Chinatown to close. The regulatory clampdown was fueled by a government study that found curbside carriers were disproportionately killing their passengers. Released by the National Transportation Safety Board, a federal agency, the study concluded that curbside bus companies were "seven times" more likely to be involved in an accident with at least one fatality than conventional bus operators. That finding was reported by The New York Times, the Los Angeles Times, Businessweek, USA Today, the New York Daily News, WNYC, and Reuters, among others. Although the study did not single out Chinatown bus companies the headline in Businessweek read, "Chinatown Buses Death Rate Said Seven Times That of Others."
The study is bogus. Not only is the "seven times" finding incorrect, the entire report is a mangle of inaccurate charts and numbers that tell us virtually nothing meaningful about bus safety. There's no evidence that curbside or Chinatown buses are any less safe than any other kind of bus.
How did the study authors figure curbside bus companies are "seven times" more prone to fatal accidents? For starters, they counted 37 accidents during the study period involving curbside buses in which there was at least one fatality. When I rebuilt the study data and contacted the companies involved, I found that, in 30 of those 37 accidents, curbside buses were not involved. In fact, 24 of those 30 misclassified cases involved Greyhound's conventional bus fleet. (Greyhound's curbside subsidiary BoltBus had no fatal accidents during the study period.)
The National Transportation Safety Board denied my requests for the study data, even though it was a taxpayer-funded report with an impact on policy. After my Freedom of Information Act request also failed to return the information following a six-month wait, I began reconstructing the study data from other sources.
Proceeding on the time-honored hunch that people who are hiding something have reason to do so, I generated a list of the 37 fatal crashes using a database obtained from a federal contractor that collects nationwide accident data. I analyzed that data with help of Aaron Brown, a quantitative analyst with the hedge fund AQR Capital Management. Brown was the first to point out major flaws in the NTSB's methodology in an article published by Minyanville.com, accusing the study authors of "statistical malpractice." I also consulted with Ed George, a professor of statistics and department chair at the University of Pennsylvania's Wharton business school, who examined the study for the purposes of this article.

"When I first read the NTSB report, I thought this is just terrible statistics," says Brown. "But it goes way beyond that. It's almost as if someone took some random data and shook it together."
The NTSB study grew out of a horrific March 2011 bus crash in the Bronx that killed 15 people. The accident, involving a bus company called World Wide Travel, was both a tragedy and an anomaly. From 2001 to 2011, there were an average of 34 fatal intercity/cross-country bus accidents each year. During the same period, there were an average of 23,000 fatal passenger car accidents annually. For every mile traveled, passengers are three times as likely to die when riding in a car than in a bus (of any sort), according to data obtained from the National Highway Traffic Safety Administration. [*]
One reason the World Wide Travel crash led to a broad study of industry safety is that it was a "Chinatown bus," according to a slew of media reports (see here, here, and here). Today, companies owned and operated by Chinese immigrants make up only a fraction of the industry, but "Chinatown bus" is often misused as a blanket term for all curbside carriers, particularly when safety is in question. The owner of the company wasn't Chinese, nor was the bus driver. But when the accident occurred the bus was destined for New York City's Chinatown to drop off its passengers, so it was a "Chinatown bus."
Enter Sen. Charles Schumer (D-NY), who had been scrambling for evidence that Chinatown buses were unsafe going back to 2005. The senator had told the New York Post at the time, "My daughter goes to college in Boston, and many of her friends ride these buses, and they said they were worried about them." After the World Wide Travel crash, Schumer held a press conference calling the safety record of these "low-cost tour bus" companies "alarming" and demanded more regulation. Schumer and Rep. Nydia Velazquez (D-NY) sent a joint letter to the NTSB requesting that it conduct a broad study of bus safety.
Velazquez and Schumer also made clear what they wanted from the study. "There is ample evidence," the lawmakers wrote the NTSB, "that the incident involving World Wide Tours [sic] is not an isolated incident but rather just one example of an industry that, in many cases, is operating outside the bounds of city, state and federal transportation safety guidelines."
After six months, the NTSB released its report on October 31, 2011. Among the lead findings was the one that curbside bus companies were seven times more likely to be involved in a fatal accident than conventional bus operators—"an amazing statistic," noted Sen. Schumer at a press conference announcing the report.
The "seven times" finding caught the attention of Aaron Brown, who has a background in statistics and applied math. He knew something was wrong. "The figure was very hard to accept," says Brown. "It takes thousands of data points to reliably establish a number like seven times in this sort of study." Realizing that fatal bus accidents are relatively rare, Brown doubted the researchers could have gathered enough data to publish such a number without major qualification.
So he obtained a copy of the study. "In situations like this, usually I find that there's an asterisk in the study and the researchers are making a more guarded statement that's been brushed aside by newspaper reporters," says Brown. "But in this case, the report said the same thing as the news accounts."
In a public docket accessible online, there is a list of the 71 companies that the NTSB classified as "curbside" and the 51 companies classified as "conventional."
These lists are jaw dropping. Greyhound and Peter Pan—the two most iconic conventional bus lines—were

categorized as "curbside" carriers.[**] It's as if a major study of the restaurant industry had classified McDonald's and Burger King as leading outdoor food trucks. Also, lesser-known carriers like Martz Trailways and Fullington Trailways are on the list. I spoke with officials at both those companies, who confirmed they are conventional bus carriers without any curbside lines.
On the "conventional" carrier list, Hampton Jitney is listed. Apparently the study authors never took part in the New York City summer ritual of getting picked up on the streets of the Upper East Side for a weekend on Long Island's beaches. (A call to Hampton Jitney confirmed that the company has no lines that pick up or drop off at a conventional station.)
The largest company on the conventional list is New Jersey Transit, a statewide public transit system, with its 2,172 buses. If public transit systems meet the study criteria, why stop with New Jersey Transit?[***]
The NTSB report states that during the study period these 71 curbside companies had 37 accidents with at least one fatality, and with a total of 52 fatalities.[****] I correlated the list of companies with federal accident data and came up with almost the same results: 37 fatal accidents and 51 fatalities. (My list is available here.)
Then I called every "curbside" company on the list that had experienced a fatal accident, including Greyhound, which was responsible for 24 of those accidents. Nearly every company I reached was not a curbside operator. I found that 30 of the 37 accidents that the NTSB classified as involving curbside buses did not involve a curbside bus. This alone invalidates almost all the study's findings. But that's just the beginning.
The study reported that curbside carriers had a fatal accident rate of 1.4 per 100 buses, while conventional carriers had a rate of 0.2 per 100 buses. Since 1.4 is seven times greater than 0.2, that's how "seven times" more got reported. Since the numerator 1.4 comes from the number of fatal accidents tallied at 37, we already know the calculation is wrong. But what about those "100 buses" the study put in the denominator?

Some press write-ups (see USA Today, Reuters, and the Los Angeles Times) naturally assumed that the study meant that curbside buses were seven times more prone to fatal accidents. To arrive at that figure, study authors would have had to add together all the buses operated by curbside companies. In fact, had the NTSB calculated the results in this way, the data would have shown essentially no difference between the fatal crash rates of curbside buses and conventional buses, even assuming the study had not mistakenly attributed those 30 extra accidents to curbside buses.
But as Aaron Brown first surmised and as the NTSB confirmed in an email, the study authors took a different approach which was misleading. They calculated the fatal accident rate for each bus company and then averaged together the company rates without taking into consideration the size of each company.
This would not have been such a problem had the number of buses operated by each company been about the same. But that wasn't at all the case.
In practice, Greyhound—let's say for a moment that the study was right in calling it a curbside bus company—had 1,515 buses and 24 accidents. Another bus company on the list, Sky Horse Bus Tour, had one bus and one fatal accident. The two companies were given equal weight. As a counterfactual, let's assume that Sky Horse's single accident hadn't occurred, but Greyhound had had 1,515 fatal accidents instead of 24. The NTSB would have come up with the same "seven times" finding. It's as if a rookie baseball player with three at bats and one hit received the same ranking as a starter with 600 at bats and 200 hits.
Even if the NTSB's method of ignoring company size told us something—and even if the accident data weren't wrong—the NTSB's "seven times" finding would still have little meaning because it doesn't achieve what researchers call statistical significance.
The chart used to arrive at the "seven times" finding is pictured to the right. There are two vertical lines in the middle of each measure called error bars. They're drawn according to a "95% confidence interval," a standard measure of statistical significance. The bars completely overlap. This means the results could have easily occurred purely by chance. A research journal with any standards would have flagged this finding as inconclusive and not fit for publication. Instead, the NTSB promoted this number to reporters without mentioning how little it actually means.
"The key to statistical analysis is that it is innocent until proven guilty," says University of Pennsylvania Wharton School statistician Ed George, who examined the NTSB study for the purposes of this article. "You would start with the assumption that there's no difference in the safety rating of curbside and conventional bus companies. Then you look for persuasive evidence otherwise. The error bars overlap in this chart, so there is not persuasive evidence."
Other problems with the NTSB study abound. The agency had no data on miles traveled, generally a key measure in any analysis of transportation safety. And the study is derived from a federal data set known for its errors and omissions because it relies on local law enforcement agencies to voluntarily report data only every two years. The study acknowledges these limitations, but the press release didn't mention them.
When I emailed NTSB press officer Eric Weiss with all the problems with the study and asked for an explanation, he offered this response: "The NTSB stands by its report."
Ironically, the regulatory crackdown that followed the release of this dreadful study may lead to more highway deaths. The shrinking of the industry has caused bus ticket prices to spike considerably in the last year. That means fewer travelers will be enticed to leave at home a far greater threat to their safety, which is sitting in their driveways.
[*] Intercity buses are even safer than the "three times" statistic implies, since it was derived from data that includes school buses and transit buses. Seventy-two percent of fatal bus accidents involve school buses and transit buses, and only 3.4 percent involve intercity buses, according to a study by the University of Michigan Transportation Research Institute.
[**] As mentioned, Greyhound and Peter Pan do have a jointly owned subsidiary, BoltBus, but it had a fleet size of just 92 buses in 2011. The NTSB's list of curbside carriers states that Greyhound has a fleet size of 1,515 buses. According to company press officer Tim Stokes, the 1,515 number may include BoltBus, but primarily refers to the parent company, which is not a curbside carrier.
[***] If New Jersey Transit, a public agency, meets the study criteria as a conventional bus company, others that should have been included are the RTD bus system in Denver, the Massachusetts Bay Transit Authority, which serves the Boston area, and Metro, which buses commuters between Washington, D.C., Virginia, and Maryland.
[****] The study data does not include the March 12, 2011 World Wide Travel accident because "due to lags in data reporting it was not yet a part of the database," according to the NTSB.


Show Comments (51)