3 Charts About Income Inequality, Transfers, and Taxes
The Congressional Budget Office (CBO) has released a study titled "The Distribution of Household Income and Federal Taxes, 2011." It's filled with tons of fascinating data and charts about how much Americans make, and how taxes and transfers affect the final distribution.
Between 1979 and 2011, CBO estimates, inflation-adjusted after-tax income for the top 1 percent increased 200 percent. For the rest of the top income quintile, the figure was 67 percent and for the three middle quintiles, inflation-adjusted after-tax income was 40 percent higher. For folks in the bottom income quintile, inflation-adjusted after-tax income was 48 percent greater.
Quintile analysis of course is a series of snapshots that don't capture mobility between income quintiles; we'll get to that in a moment.
Here's a breakdown of income quintiles, pre- and post-tax and transfers, in 2011:
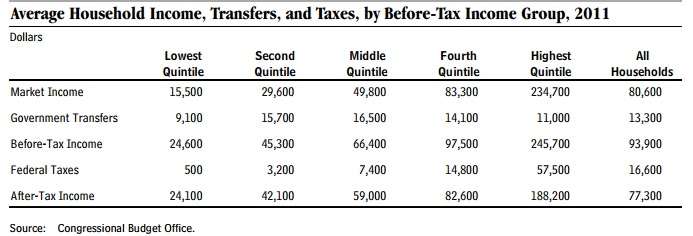
"Transfers" include "cash payments and in-kind benefits from social insurance and other government assistance programs. Those transfers include payments and benefits from federal, state, and local governments." What should be surprising is that even households in the top 20 percent of income pull down $11,000 on average in transfers even as they pay 23 percent in federal taxes on before-tax income.
Here's how different quintiles saw income grow.
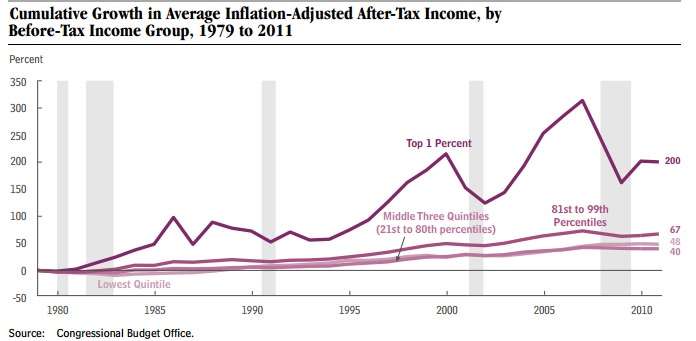
While all groups saw increases, the middle-three quintiles gained less (40 percent each on average) than any other group.
Between 1979 and 2011, the Gini Index, a measure of income inequality, increased whether talking about pre-tax or post-tax income. In terms of straight "market income" (a measure of all income from all non-transfer sources), it increased from below 0.5 to 0.59. Based on before-tax income, it went from 0.4 to 0.47. And for after-tax income, it went from around 0.36 to 0.44.
CBO notes that federal tax and transfer policy reduced the increase in after-tax inequality by 26 percent from what it would have been otherwise, with the majority coming from transfers, not taxes. That's despite the aggressive—if often unacknowledged—progressivity of the U.S. tax system, which is far more progressive than systems of other developed countries. As Veronique de Rugy has pointed out in Reason and elsewhere, European countries typically charge more of their residents more taxes at all levels, especially in the form of value-added taxes (on the flip side, those countries typically give more straight transfers to citizens too). The U.S. system, argues de Rugy, hides many of its costs because "it disproportionately relies on the top earners to raise revenue, it exempts a large class of taxpayers from paying any income taxes, and it conceals spending in the form of tax breaks." A more transparent system might have lower marginal rates but fewer if any exemptions.
So, does increased income inequality reduce economic mobility? Intelligence Squared recently hosted a debate on the issue, featuring the Manhattan Institute's Scott Winship, whose work is often cited here. The entire debate is worth a listen but Winship's main point is that income mobility—the ability for an individual or particular household—to move up or down the income ladder is unrelated to whether the rungs of the ladder are being more widely spread out. Winship is a critic of mobility rates—he thinks they are too low—but he persuasively documents that those rates haven't changed over the past 30-plus years even as income inequality has increased. Read some his reasons here.


