Who Really Likes the Police? Older, Richer, White, Conservative Republicans.

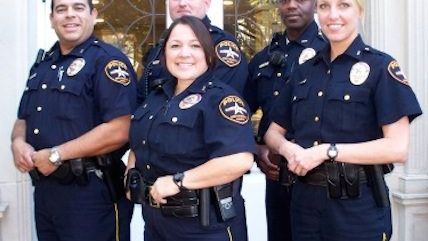
Americans like the police, but older, more affluent, white, conservative Republicans really like the police. Fully 72 percent of Americans say they have a favorable view of the police, and 24 percent have an unfavorable view, according to the latest Reason-Rupe poll. However, favorability has declined 6 points since the question was asked in April earlier this year. It's possible greater public awareness of police militarization in the aftermath of the Ferguson, MO protests has undermined public confidence.
While majorities of Americans have a favorable opinion of the police, intensity of support varies widely across groups. Most striking are differences across race/ethnicity.
Fully 80 percent of white Americans have a positive view of the police, with 43 percent who are veryfavorable. However only 52 percent of black and Hispanic Americans share this favorable view, and only 2 in 10 have a strongly favorable opinion of the police. Forty-three percent of African-Americans and 46 percent of Latinos have an unfavorable view of the police, compared to 17 percent of Caucasians.
Democrats (66%) and independents (60%) are also considerably less favorable of the police compared to Republicans (85%). However, different racial compositions within the political parties explain part of the difference. Only 55 percent of nonwhite Democrats like the police, compared to 75 percent of white Democrats, and 86 percent of white Republicans.
While liberals tend to be more distrustful of the police than conservatives—fiscal conservatives are themselves divided. Using the Reason-Rupe typology, social conservatives (51%) are more likely than libertarians (41%) to have a strongly favorable view. Only 30 percent of liberals and 35 percent of communitarians share conservatives' strongly favorable attitudes toward the police.
Older and wealthier Americans are also more likely to like the police. For instance, 83 percent of seniors are very favorable toward the police, and fully 50 percent are very favorable. In contrast, 60 percent of 18-29 years are favorable, and 30 percent are very favorable. Similarly by income, 83 percent of households making more than $90,000 a year have a favorable view, including 47 percent with a strongly favorable opinion. However, considerably fewer (65%) among those making less than $45,000 annually share a favorable view of the police, including only 30 percent with a strongly favorable view.
A standard statistical procedure to simultaneously account for basic demographic characteristics finds that being Caucasian, higher income, and from the South are the strongest statistically significant predictors of support for the police, followed by being a Republican, and a woman.
As to be expected, those who have a favorable view of police officers are most likely to think officers are generally held accountable for misconduct (61%), only use lethal force when necessary (59%), and believe the criminal justice system is fair to all races (51%). Conversely, those with a negative view of the police are far less likely to believe police officers are held accountable (22%), use lethal force only when necessary (22%), and say the justice system lacks racial bias (26%).
The Reason-Rupe national telephone poll, executed by Princeton Survey Research Associates International, conducted live interviews with 1004 adults on cell phones (503) and landlines (501) October 1-6, 2014. The poll's margin of error is +/-3.8%. Full poll results can be found here including poll toplines (pdf) and crosstabs (xls).


Show Comments (96)