One of the most provocative and persistent arguments against free-market capitalism claims that it's a rigged system in which those who are already wealthy are the only ones who really benefit. Under the pretense of being a wide-open meritocracy, the critique goes, what we call capitalism is really a closed system that not only distributes income gains unfairly but makes the poor feel as if their position in their lives is their fault. Market critics call for all sorts of interventions, transfers, and limits on freedom to make things right.
In a new and important article at Medium, economist Russ Roberts, who produces the great weekly podcast Econtalk and has written a shelf full of books defending a libertarian view of markets and culture, provides a powerful critique of the idea that the rich are simply getting richer while poor and middle-income Americans see their incomes and options stagnate. When critics of market economies such as Thomas Piketty, Paul Krugman, Jared Bernstein, and others say that middle- and low-income Americans haven't gained income over the past 30 or so years, argues Roberts, they typically mis-measure the rate of inflation, ignore the growing role that fringe benefits play in total compensation, and include the elderly, who are less likely to be working full-time and thus skew results. But the really important omission, says Roberts, is that most critics fail to track specific individuals over time. Instead they track statistical averages. When you follow an individual income earner over the years, a very different—and much more optimistic—picture emerges:
Researchers look at the median income of the middle quintile in 1975 and compare that to the median income of the median quintile in 2014, say. When they find little or no change, they conclude that the average American is making no progress….
When you follow the same people over time, you get very different results about the impact of the economy on the poor, the middle, and the rich.
Studies that use panel data?—?data that is generated from following the same people over time?—?consistently find that the largest gains over time accrue to the poorest workers and that the richest workers get very little of the gains. This is true in survey data. It is true in data gathered from tax returns.
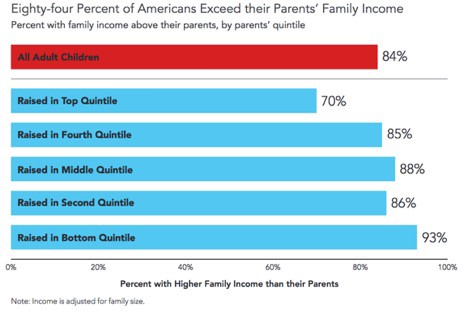
What do the data show? One study finds that when you compare the income of parents working in the early 1960s to their children's income from the early 2000s, "84% earned more than their parents, corrected for inflation. But 93% of the children in the poorest households, the bottom 20% surpassed their parents. Only 70% of those raised in the top quintile exceeded their parent's income." A different study also found that kids in lower-income groups were far more likely to outstrip their parents' income than those born to wealthy parents: "70% of children born in 1980 into the bottom decile exceed their parents' income in 2014. For those born in the top 10%, only 33% exceed their parents' income."
Pew Charitable Trusts
Roberts notes that it's obviously easier for a kid whose parents made, say, $20,000 to earn more than it is for those who were born to millionaires. But there's more going on here, and it's all to the good. He cites another study that
looks at people who were 35–40 in 1987 and then looks at how they were doing 20 years later, when they are 55–60. The median income of the people in the top 20% in 1987 ended up 5% lower twenty years later. The people in the middle 20% ended up with median income that was 27% higher. And if you started in the bottom 20%, your income doubled. If you were in the top 1% in 1987, 20 years later, median income was 29% lower.
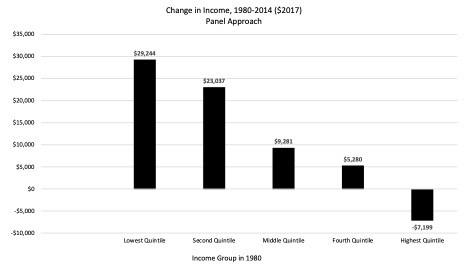
Perhaps the most stunning indicator comes from a study that looks at income changes for individuals between 1980 and 2014. If you simply measure statistical averages, "the average income of the top 1%…went from $189,000 to $843,000, which seems to confirm the view that most of the gains from economic growth go to the richest of the rich while people in the middle or the bottom make no progress at all. But the people in the top 1% in 2014 are not the same people in 1980. What happens when you follow the same people?"
The answer, Roberts writes, is that the
richest people in 1980 actually ended up poorer, on average, in 2014. Like the top 20%, the top 1% in 1980 were also poorer on average 34 years later in 2014. The gloomiest picture of the American economy is not accurate. The rich don't get all the gains. The poor and middle class are not stagnating.
Medium, Russ Roberts
Roberts is no Dr. Pangloss when it comes to the current U.S. economy, which he recognizes is filled with special carve-outs and privileges for the well-off and connected. The numbers he's mostly talking about have more to do with what's considered "absolute mobility" (how much better off are you than where you started) than "relative mobility" (whether each slice of society has the ability to move up), which he says is still too small. And he offers some policies that would certainly make the economy freer and fairer to all of us:
This does not mean that everything is fine in the American economy. There are special privileges reserved for the rich that help them reduce their risk of downward mobility?—?financial bailouts are the most egregious example. There are too many barriers like occupational licensing and the minimum wage that handicap the disadvantaged desperately trying to succeed in the workplace. And the American public school system is an utter failure for too many children who need to acquire the skills needed for the 21stcentury. But the glass is at least half-full. If we want to give all Americans a chance to thrive, we should understand that the standard story is more complicated than we've been hearing. Economic growth doesn't just help the richest Americans.
As Roberts' former George Mason University colleague Tyler Cowen said in yesterday's Reason Podcast, if we are serious about improving living standards, we need to commit to policies that promote long-term, sustainable economic growth. Roberts' focus on actual individuals and their relationship to growth helps to explain better not just where we are, but how to get to a place where mobility is even more likely to happen.
Editor's Note: As of February 29, 2024, commenting privileges on reason.com
posts are limited to Reason Plus subscribers. Past commenters are grandfathered in for a temporary
period.
Subscribe
here to preserve your ability to comment. Your
Reason Plus subscription also gives you an ad-free version of reason.com, along with full access to the
digital
edition and archives of Reason magazine. We request that comments be civil and on-topic. We do
not moderate or assume any responsibility for comments, which are owned by the readers who post them. Comments
do not represent the views of reason.com or Reason Foundation. We reserve the right to delete any comment and
ban commenters for any reason at any time. Comments may only be edited within 5 minutes of posting. Report abuses.
Just as the trend since the printing press is increased decentralization of information and influence, so has the trend throughout history been to spread the wealth. Instead of a few kinds and nobles, the Industrial Revolution created thousands of wealthy merchants who got their wealth by selling all sorts of stuff to the masses, who must have gotten wealthier in the process or they could not have afforded to buy things and make merchants wealthier. That process continues; more and more poor people are less poor, because merchants don't get rich selling to each other, but by selling to the masses.
Piketty is a damned fool who distorts and cherry picks data better than most. Krugman is just an idiot who decided a Nobel was the end of his need to think.
Meanwhile capitalists go on making themselves richer by making far more people even richer, relatively speaking.
"is that most critics fail to track specific individuals over time. Instead they track statistical averages. When you follow an individual income earner over the years, a very different?and much more optimistic?picture emerges."
A better picture is obtained by sampling some individual or other rather than the median? Does Roberts believe that median averages are useless in all cases?
"Exceeding parents income" is a poor metric. Because a dollar in a lower quintile is a much larger percentage of parent's income than it is in the top quintile.
Robert's scribbles appear to be motivated for a particular result. It is the inverse of this week's column by Chris Hedges; "The Rule of the Uber-Rich Means Tyranny or Revolution".
The truth is unlikely to be either of these extremes.
You make no sense. The point of following panels- not a couple individuals, but a group of like people- is that it gives a more accurate picture of what is happening. When people talk about the middle class not growing, they paint a picture of your dad working year after year, earning the same wage, so that his kids can work year after year to earn the same wage, while the rich get richer.
By following panels, we see something different. We see that Dad is working his ass off as middle class, and that in 15 years he is in the upper middle class. Meanwhile his kids will be upper middle class and likely do better than him when they are his age. This is something that quintiles are not able to show- one way or the other.
Of course all the claims of a "rigged" system by leftists is merely an excuse to forcibly redistribute wealth - which is what they've always wanted to do regardless.
Otherwise the obvious solution to any system rigging is to eliminate the rigging.
But that wouldn't leave them with any excuse to continue trying to redistribute wealth and we can't have that.
I suppose if an article feels the need to describe an argument as 'strong' rather than demonstrate it as strong, than one is going to have to accept 'strong' in it's Orwellian definition.
There's a thing call the Gini Index which can be used as an indication of economic inequality or wealth distribution and which was a invented by an Italian statistician, Corrado Gini, back in 1912. It runs from 0 to 1 (or in some cases from 0 to 100). A value of zero means that everybody has the same income. A value of one (or 100) means that one person earns all the money and everybody else earns nothing.
The country with the highest Gini index is South Africa. Its index (measured in 2011) is 0.634 (or 63.4 on the 0-100 scale). The lowest are almost all in Europe, and are under 0.3 (or 30 in the 0-100 scale). In contrast, the US is at 0.41 (measured in 2013). But there's a catch. In the US its value has been climbing for decades.
In 1979 it was only 0.346. By 1986 it had risen to 0.375, and then to 0.382 (1991), 0.402 (1994), 0.408 (1997), then after a slight dip in 2000 to 0404), it rose again to 0.411 in 2007. During the early Obama years it again dipped a smidgin (to 0.404 in 2010), but soon started climbing again, reaching 0.410 in 2013.
What does all this mean? It suggests that Russ Roberts's claim that US economic growth is NOT all going to the rich is, at best, only partly true. In the US wealth is steadily becoming concentrated into fewer and fewer hands; and that such a trend has been going on for decades.
"There's a thing call the Gini Index which can be used as an indication of economic inequality or wealth distribution"
"can be used"
More like has been claimed to be an indication of economic inequality.
Kind of like the way GDP is claimed to be a metric of economic prosperity even though the formula includes government spending which amounts to nothing more than forced transfer payments that can never to any value greater than zero.
At least part of this sounds like a straightforward case of regression to the mean. On average, someone with a very low income this year is someone for whom it's an unusually bad year. He will not only be better off twenty years later, he will be better off one year later--or one year earlier.
The same applies to the comparison of parents and their children. If you look at the bottom 20%, judged by income in one year, you are in part selecting for people for whom that was a particularly bad year. When you look at their children many years later there is no such selection, so even if nobody is getting richer on average, the children will, on average, be doing better than the parents.
Ideally, you would like to compare the present value at birth of the lifetime income stream of the parent (aka "permanent income") with the present value at birth of the lifetime income stream of the child.
Looking at the Russ Roberts piece after writing the comment above, I notice that he discusses problem of regression to the mean and offers evidence that that is not all that is happening.
Isn't economic mobility the bug, not the feature?
People are getting rich, and we can't have that, because people got left behind or... not ALL people got rich at an equal and sustained rate.
What's worse, mobility discriminates in favor of people who do good things and against people who do unproductive things.
Just as the trend since the printing press is increased decentralization of information and influence, so has the trend throughout history been to spread the wealth. Instead of a few kinds and nobles, the Industrial Revolution created thousands of wealthy merchants who got their wealth by selling all sorts of stuff to the masses, who must have gotten wealthier in the process or they could not have afforded to buy things and make merchants wealthier. That process continues; more and more poor people are less poor, because merchants don't get rich selling to each other, but by selling to the masses.
Piketty is a damned fool who distorts and cherry picks data better than most. Krugman is just an idiot who decided a Nobel was the end of his need to think.
Meanwhile capitalists go on making themselves richer by making far more people even richer, relatively speaking.
When you follow an individual income earner over the years, a very different?and much more optimistic?picture emerges...
What kind of car does Roberts drive. I could swear the last few weeks I've seen the same dark sedan behind me on my way to Chili's.
Chili's? I thought Russ said optimistic.
"is that most critics fail to track specific individuals over time. Instead they track statistical averages. When you follow an individual income earner over the years, a very different?and much more optimistic?picture emerges."
A better picture is obtained by sampling some individual or other rather than the median? Does Roberts believe that median averages are useless in all cases?
"Exceeding parents income" is a poor metric. Because a dollar in a lower quintile is a much larger percentage of parent's income than it is in the top quintile.
Robert's scribbles appear to be motivated for a particular result. It is the inverse of this week's column by Chris Hedges; "The Rule of the Uber-Rich Means Tyranny or Revolution".
The truth is unlikely to be either of these extremes.
You make no sense. The point of following panels- not a couple individuals, but a group of like people- is that it gives a more accurate picture of what is happening. When people talk about the middle class not growing, they paint a picture of your dad working year after year, earning the same wage, so that his kids can work year after year to earn the same wage, while the rich get richer.
By following panels, we see something different. We see that Dad is working his ass off as middle class, and that in 15 years he is in the upper middle class. Meanwhile his kids will be upper middle class and likely do better than him when they are his age. This is something that quintiles are not able to show- one way or the other.
Of course all the claims of a "rigged" system by leftists is merely an excuse to forcibly redistribute wealth - which is what they've always wanted to do regardless.
Otherwise the obvious solution to any system rigging is to eliminate the rigging.
But that wouldn't leave them with any excuse to continue trying to redistribute wealth and we can't have that.
>>>if we are serious about improving living standards
living standards need improvement?
Furthermore the notion that everyone deserves some guaranteed "share" of macroeconomic growth is absurd.
As Clint Eastwood said in "Unforgiven", "deserves got nuthin to do with it".
Not everyone contributes equally to economic growth and some don't contribute at all.
I suppose if an article feels the need to describe an argument as 'strong' rather than demonstrate it as strong, than one is going to have to accept 'strong' in it's Orwellian definition.
There's a thing call the Gini Index which can be used as an indication of economic inequality or wealth distribution and which was a invented by an Italian statistician, Corrado Gini, back in 1912. It runs from 0 to 1 (or in some cases from 0 to 100). A value of zero means that everybody has the same income. A value of one (or 100) means that one person earns all the money and everybody else earns nothing.
The country with the highest Gini index is South Africa. Its index (measured in 2011) is 0.634 (or 63.4 on the 0-100 scale). The lowest are almost all in Europe, and are under 0.3 (or 30 in the 0-100 scale). In contrast, the US is at 0.41 (measured in 2013). But there's a catch. In the US its value has been climbing for decades.
In 1979 it was only 0.346. By 1986 it had risen to 0.375, and then to 0.382 (1991), 0.402 (1994), 0.408 (1997), then after a slight dip in 2000 to 0404), it rose again to 0.411 in 2007. During the early Obama years it again dipped a smidgin (to 0.404 in 2010), but soon started climbing again, reaching 0.410 in 2013.
What does all this mean? It suggests that Russ Roberts's claim that US economic growth is NOT all going to the rich is, at best, only partly true. In the US wealth is steadily becoming concentrated into fewer and fewer hands; and that such a trend has been going on for decades.
"There's a thing call the Gini Index which can be used as an indication of economic inequality or wealth distribution"
"can be used"
More like has been claimed to be an indication of economic inequality.
Kind of like the way GDP is claimed to be a metric of economic prosperity even though the formula includes government spending which amounts to nothing more than forced transfer payments that can never to any value greater than zero.
He may be convincing, but he's still bringing a knife to a gun fight.
At least part of this sounds like a straightforward case of regression to the mean. On average, someone with a very low income this year is someone for whom it's an unusually bad year. He will not only be better off twenty years later, he will be better off one year later--or one year earlier.
The same applies to the comparison of parents and their children. If you look at the bottom 20%, judged by income in one year, you are in part selecting for people for whom that was a particularly bad year. When you look at their children many years later there is no such selection, so even if nobody is getting richer on average, the children will, on average, be doing better than the parents.
Ideally, you would like to compare the present value at birth of the lifetime income stream of the parent (aka "permanent income") with the present value at birth of the lifetime income stream of the child.
Looking at the Russ Roberts piece after writing the comment above, I notice that he discusses problem of regression to the mean and offers evidence that that is not all that is happening.