Map of Global Shipping Highlights North Korea's Isolation
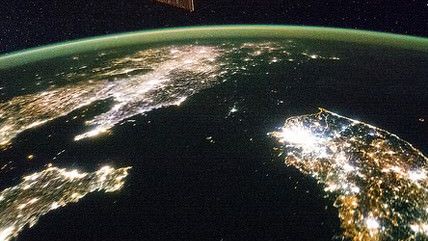
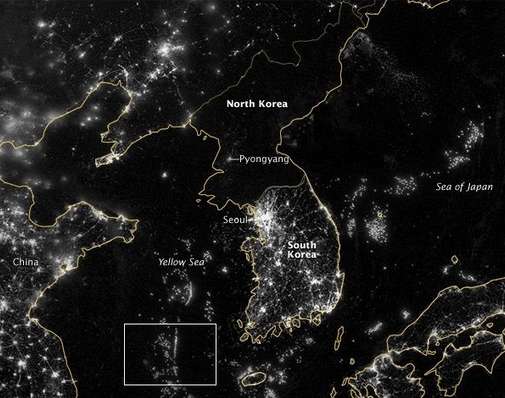
Many readers will be familiar with photos of the Korean peninsula at night showing the stark differences between the economies of the capitalist south and the isolated, Stalinist north. An example of one such photo is below:
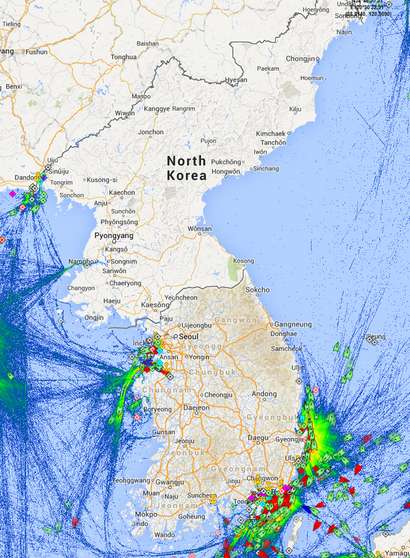
Over at the London-based City A.M. Peter Spence has found another way to highlight North Korea's isolation. The website marinetraffic.com tracks ships using AIS (Automatic Identification System) transponders, which are required by the International Maritime Organization for all ships over 299 gross tonnage.
Below is a map from marinetraffic.com of the Korean peninsula. It shows the location of ships as well as shipping density:
Spence mentions a World Bank report that highlights the differences between North Korea and South Korea's economic performance:
An openness to trade has helped to contribute to South Korea's economic growth miracle. The World Bank says that the country "has experienced remarkable success in combining rapid economic growth with significant reductions in poverty." In 2013 South Korea boasted an estimated GDP per capita of $33,200. North Korea's by contrast, was estimated at a mere $1,800 in 2011.
Perhaps looking at volumes of shipping to each of the Koreas is an unfair comparator, as North Korea is able to take greater advantage of rail links to the continent, but neighbouring China itself is a hive of cargo ship activity. The port of Dandong, close to the China-North Korea border is itself incredibly popular.
More from Reason on North Korea here.


