What Current Data Tell Us About How the Pandemic Could Play Out This Winter
Peaks and valleys, a fall peak, or a slow burn?

Winter is coming, and diagnosed cases of COVID-19 are increasing in the U.S. (and in Europe). Way back on April 30, researchers associated with the Center for Infectious Disease Research and Policy (CIDRAP) released a report in which they outlined three scenarios, based on past influenza pandemics, for how the COVID-19 pandemic might play out in the United States over the next couple of years.
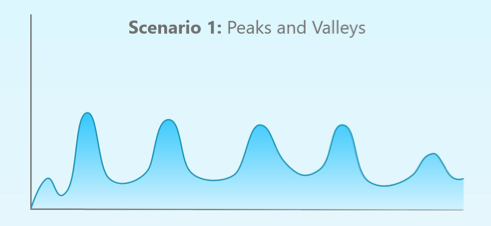
In Scenario 1, the first wave of COVID-19 in spring 2020 is followed by a series of repetitive smaller waves that occur through the summer and then consistently over a one- to two-year period, gradually diminishing sometime in 2021. The occurrence of these waves may vary geographically and may depend on what mitigation measures are in place and how they are eased.
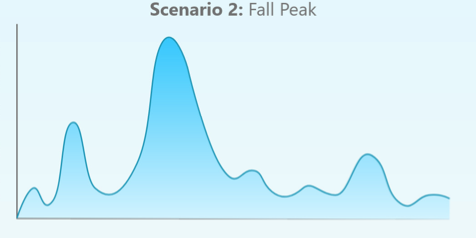
In Scenario 2, the first wave of COVID-19 in spring 2020 is followed by a larger wave in the fall or winter of 2020 and one or more smaller subsequent waves in 2021. This pattern will require the reinstitution of mitigation measures in the fall, in an attempt to drive down the infection's spread and to prevent health care systems from being overwhelmed. This pattern is similar to what was seen with the 1918–19 Spanish influenza pandemic.
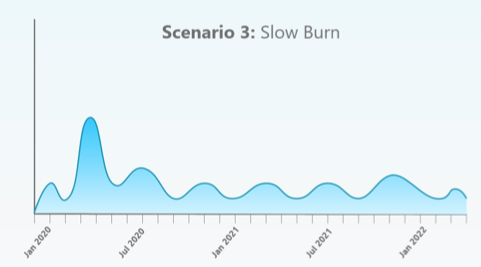
In Scenario 3, the first wave of COVID-19 in spring 2020 is followed by a "slow burn" of ongoing transmission, but without a clear wave pattern. This third scenario likely would not require the reinstitution of mitigation measures, although cases and deaths would continue to occur.
So: Six months later, how has the pandemic actually been evolving? Let's take a look at the the daily diagnosed cases as recorded by the COVID Tracking Project.
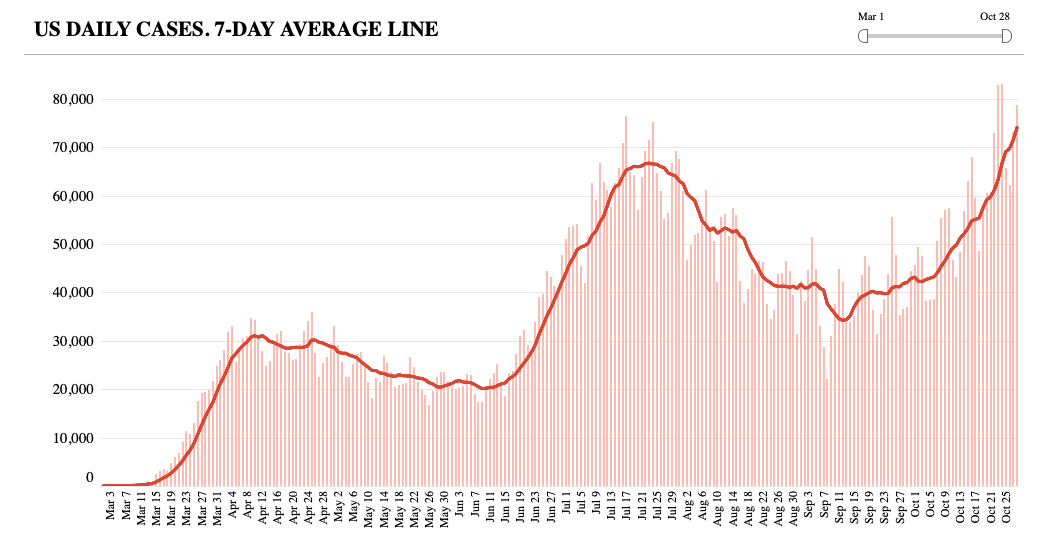
Eyeballing the trend in daily diagnosed U.S. cases would seem to rule out the slow burn of Scenario 3, but the data cannot yet distinguish between the peaks and valleys in Scenario 1 and the fall peak in Scenario 2.
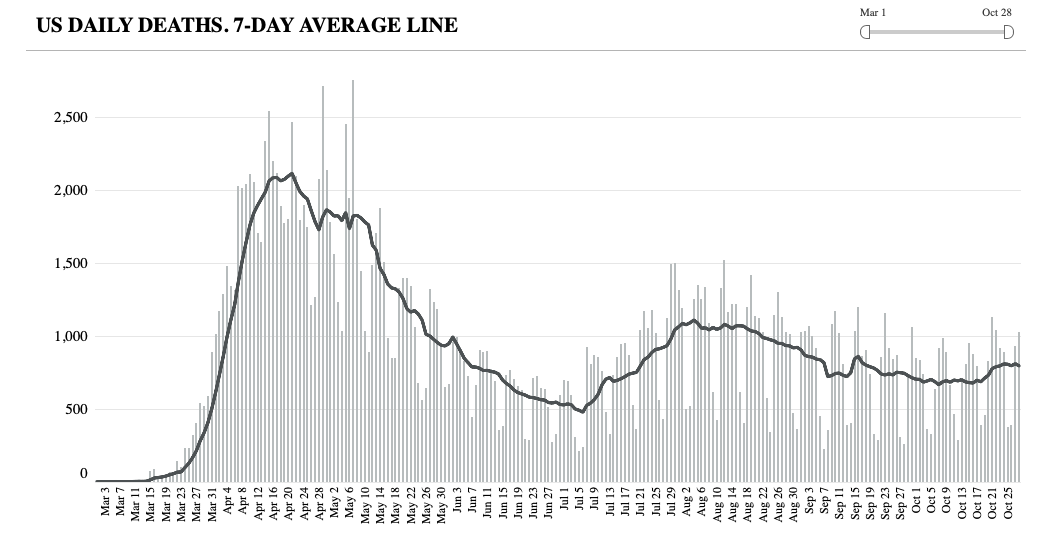
Although the number of diagnosed cases is ascending, the COVID Tracking Project's data on deaths have been flattish at around 900 per day. That suggests that a different, less vulnerable age cohort has been getting infected and that clinicians have gotten better at treating COVID-19 patients. But in the absence of widely deployed effective vaccines, that trend isn't likely to remain flat if the pandemic tracks Scenario 2.


