Extreme Climate Change Has Arrived in America, Says The Washington Post
Rising temperatures are mostly happening in the winter and at night.

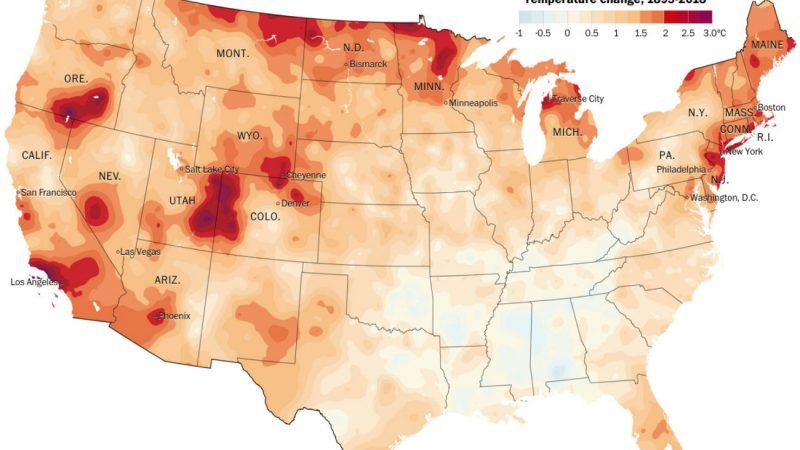
The Washington Post's front page features "2°C: BEYOND THE LIMIT"—an article detailing changes in temperature trends in the U.S. since 1895. The 2-degree Celsius benchmark is taken from the Paris Agreement, a multinational pledge that seeks to keep Earth's average temperature increases "well below" 2 degrees Celsius by the year 2100.
Using National Oceanic and Atmospheric Administration temperature data across the Lower 48 states and 3,107 counties, the Post reports that major areas in the U.S. are nearing or have already crossed that 2-degree Celsius mark.
The article opens with a vignette noting that ice no longer reliably forms on Lake Hopatcong in New Jersey. As the Post notes, the average temperature in New Jersey has climbed by close to 2 degrees Celsius since 1895—double the average for the Lower 48 states.
So how did the Post derive its U.S. temperature trend figures?
We calculated annual mean temperature trends in each state and county in the Lower 48 states using linear regression—analyzing both annual average temperatures and temperatures for the three-month winter season (December, January, and February). While not the only approach for analyzing temperature changes over time, this is a widely used method.
As the Post notes, this is not the only way to analyze temperature changes over time. As it happens, a team of researchers from Boise State and Clemson University published an article on trends in extreme U.S. temperatures in the Journal of Climate in 2014 that used a different method for analyzing U.S. temperature trends between 1890 and 2010. For the analysis, the researchers used temperature data taken from the three-quarters of weather stations in the U.S. Historical Climate Network that have nearly complete records. Instead of averaging, they tracked the trends in the maximum and minimum daily monthly temperatures at each station.
What they found is that for maximum temperatures (typically during the day and in summer) 583 of the 923 stations had negative trends with a "warming hole" in the eastern United States that many other researchers had previously noted.
On the map, the color shades run from bright red (the most warming) to deep blue (the most cooling). In aggregate, the researchers report, maximum temperatures are decreasing in the eastern United States, with the exception of New England. In contrast, the western U.S. maximum temperatures are slightly warming for the most part.
What about minimum temperatures, e.g., those that typically occur during the night and in winter? With the exception of two localized pockets in the Southeast and Colorado, the researchers note, cooling is sparse. The Southeast is the most significantly cooling location; confidence that minimum temperatures are warming is comparatively large for the western United States, northern Midwest, and New England.
Overall, the researchers conclude that the U.S. average trend for maximum temperatures is negative -0.468°C per century, while the average trend for minimum temperatures is strongly positive at +1.646°C per century. The fact that winters in the U.S. are becoming warmer explains why fewer lakes like Lake Hopatcong are freezing over.
On the Washington Post temperature trend map, north-central Minnesota is colored bright red, indicating that temperatures in the region have already exceeded the dire 2°C threshold. It appears that Cass Lake is located there, so I decided to check out the average temperatures for that area.
Since most of the warming is occurring during the winter, let's look at average January temperatures: In that frigid month, the average high temperature is 18°F (-8°C) and the average low is -5°F (-21°C). Let's neglect the fact that the way the Washington Post calculated the trends in that area suggests that these averages are already higher due to climate change. Nevertheless, adding an extra 2°C of warming would boost the current winter high average up to 21°F and the average low to -0.4°F.
The map from Journal of Climate researchers shows essentially no increase in maximum temperatures in that part of Minnesota but it does show an increase in minimum temperatures there. Assuming that extra warming is largely channeled into nighttime lows, that suggests a 2°C increase during July would raise the average nighttime low from 56 to 59.5°F.
As the rise in minimum temperatures indicates, climate change in the U.S. is definitely happening. But unless you are a fan of winter (a concept that I personally do not understand) the extremes that most folks will worry about are maximum summertime temperatures.


Show Comments (65)