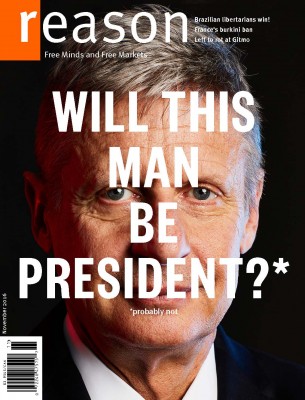
Gary Johnson Beating the Clinton-Trump Spread Across One-Third of the Country
The Libertarian's polling support exceeds the Democrat-Republican margin throughout the interior west, Midwest, and in key swing states

In 2012, Libertarian Party presidential nominee Gary Johnson did not receive more votes than the margin between Barack Obama and Mitt Romney in any single state. In fact, he didn't come particularly close—0.53 percent of the vote in Florida, where Obama won by 0.88 percentage points, was the only instance in which Johnson's total was even half the major-party point spread.
Mostly, that was because the election just wasn't close in most of the country. While Johnson's 0.99 percent national total might seem to be in the ballpark of the 3.87-point difference between Obama's winning 51.17 percent and Romney's losing 47.32, the fact is that a whopping 36 states (including the District of Columbia) were decided by double-digit margins. A measly four states—Florida, North Carolina (2.04 percentage points), Ohio (2.98) and Virgina (3.88)—were decided by less than five.
Oh, what a difference four years makes. Not only is Johnson mounting the biggest third-party presidential challenge in two decades, his impact on a state-by-state level is changing the Electoral College dynamic from 2012 in interesting ways. Across the country, and regardless of whether a state is red or blue, the polling margin between the Democratic and Republican nominee is almost universally smaller than the election results were four years ago. And according to my back-of-the-envelope calculations below, the Libertarian is exceeding those margins in 18 states.
I took FiveThirtyEight's up-to-date poll numbers for each state, and averaged them with RealClearPolitics' "RCP Average." (This is a somewhat crude maneuver; see the bottom of this post* for some methodological considerations; but still, it gives us a rough idea.) The following is a list of those 18 states ranked by the percentage-point distance between Gary Johnson's polling average and the current margin between the leading two candidates. The numbers displayed are, in order: Johnson's current polling in that state, the size (and owner) of the lead, the distance between those first two numbers (in bold), then Johnson's 2012 total and the size/recipient of the point spread in that election:
NM 17.0% HC 9.0 + 8.0 2012 GJ 3.55% BO 10.15
AZ 7.9% DT 1.5 + 6.4 2012 GJ 1.40% MR 9.06
NV 7.1% HC 1.7 + 5.4 2012 GJ 1.08% BO 6.68
IA 8.2% DT 2.8 + 5.4 2012 GJ 0.82% MR 5.81
OH 6.1% DT 1.0 + 5.1 2012 GJ 0.89% BO 2.98
NC 6.6% HC 1.6 + 5.0 2012 GJ 0.99% MR 2.04
NH 9.7% HC 4.9 + 4.8 2012 GJ 1.16% BO 5.58
AK 13.7% DT 9.4 + 4.3 2012 GJ 2.46% MR 13.99
CO 8.9% HC 4.9 + 4.0 2012 GJ 1.38% BO 5.36
ME 9.8% HC 5.9 + 3.9 2012 GJ 1.31% BO 15.29
FL 5.2% HC 1.9 + 3.3 2012 GJ 0.53% BO 0.88
WI 8.6% HC 5.3 + 3.3 2012 GJ 0.67% BO 6.94
GA 6.8% DT 5.1 + 1.7 2012 GJ 1.16% MR 7.82
VA 8.1% HC 6.6 + 1.5 2012 GJ 0.81% BO 3.88
MI 7.7% HC 6.6 + 1.1 2012 GJ 0.16% BO 9.50
IN 9.7% DT 8.7 + 1.0 2012 GJ 1.91% MR 10.20
MN 5.8% HC 5.0 + 0.8 2012 GJ 1.20% BO 7.69
PA 5.6% HC 5.4 + 0.2 2012 GJ 0.87% BO 5.38
A few items of interest here: 1) Note that the Obama 2012 state of Ohio is leaning Trump in 2016, and that Romney's North Carolina is currently led by Hillary Clinton. 2) The biggest tightening of margins on this list are in Maine (9.4 percentage points), Arizona (7.6), and Nevada (5.0). Looking at the states in which Johnson is not beating the spread, the biggest margin-changer, by far, is Utah, at 32.2 percentage points (I have Johnson polling at 11.8 percent there). 3) Nationally, Johnson has consistently been pulling equally from Clinton, Trump, and Other/Not-voting. While Jacob T. Levy has argued persuasively that Johnson on balance slightly helps Clinton (at least thus far), his impact is less studied on a state-by-state level. (I hope to do that here soon!)
Though I won't post the full numbers on the rest of the country, here are the 14 states in which there are more than 10 percentage points separating Johnson's polling average and the margin between the two leading candidates:
NY 6.5% HC 18.6 -12.1
WV 8.1% DT 20.8 -12.7
VT 10.0% HC 23.0 -13.0
ID 9.0% DT 22.0 -13.0
MA 7.7% HC 21.5 -13.8
OK 6.9% DT 21.1 -14.2
CA 5.9% HC 20.9 -15.0
NE 7.3% DT 22.6 -15.3
AR 4.7% DT 21.5 -16.8
AL 5.0% DT 22.1 -17.1
WY 9.2% DT 32.1 -22.9
MD 5.2% HC 29.9 -25.7
HI 5.1% HC 33.3 -28.2
DC 5.3% HC 63.7 -58.4
So even with two historically reviled candidates, and the shrinking margins between them, huge swaths of the country live in states where the presidential election is a foregone conclusion. After the jump, some notes on methodology.
* Averaging FiveThirtyEight and the RCP Average presents an obvious objection: There are way more polls collected and digested by the former than the latter—taking Texas as an example, 538 collates 26, RCP just three. So why do it?
Mostly because FiveThirtyEight steadfastly refuses to acknowledge the presence of Green Party nominee Jill Stein, let alone other candidates (the latter would have the most impact on places like Colorado and Utah, where the ballots are crowded and Evan McMullin is pulling tangible support). RealClearPolitics at least measures Stein where she pops up, and since there is a real "Stein effect" on the other candidates, I'd like to see that reflected. In any event, with only two or three exceptions, the numbers are pretty similar in each. When I revisit this list, or drill down deeper into a given state, I'll separate things with more precision.


Show Comments (38)