What Can Satellite Night-Time Photos Tell Us About the State of Global Poverty?


Economists Maxim Pinkovskiy of the Federal Reserve Bank of New York and Xavier Sala-i-Martin of Columbia University have written a paper on a new way to assess the state of global poverty.
Over at the Adam Smith Institute's blog Tim Worstall summarizes the problem Pinkovskiy and Sala-i-Martin are addressing:
A government that hasn't quite worked out how to collect the rubbish isn't going to be all that good at counting the people nor what they do or earn.
The upshot of this is that we really don't know how many poor people there are out there. We know there are fewer than there used to be, and the poor are a very much smaller portion of the growing population than used to be true, but we really only know trends rather than actual numbers. Basically because the numbers we've got for things like GDP and inequality are so sketchy themselves.
What Pinkovskiy and Sala-i-Martin are proposing is the following:
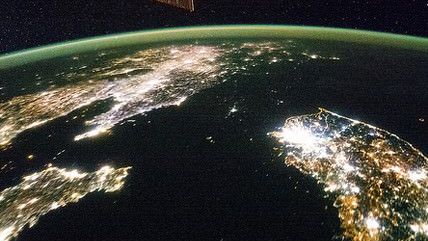
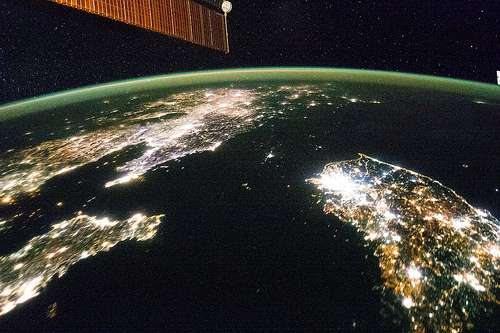
In new research we suggest such a data-driven way to assess the relative quality of national accounts and survey means by using a third, independently collected data source on economic activity. This data is satellite-recorded luminosity at night as measured by weather satellites of the National Oceanic and Atmospheric Administration (NOAA). The advantage of this data is that measurement error in night-time lights is unrelated to measurement errors in national accounts or surveys, making lights an independent measurement of true income, against which we can assess the other measurements.
To disentangle whether national accounts or survey means are closer to true income we postulate a factor model in which national accounts GDP per capita, survey means and night-time lights are linear functions of unobserved, true income (and, potentially, other covariates), perturbed by random disturbances.
What is particularly interesting about Pinkovskiy and Sala-i-Martin's paper is that it concludes with some encouraging news:
Under our procedure, developing world poverty declines from 11.8% in 1992 to 6.1% in 2005 and 4.5% in 2010, much lower than the path constructed by giving a weight of 1 to the surveys, which entails poverty falling from 42% to 20.5% between 1992 and 2010. We run a battery of robustness checks on our findings; under the ones most favourable to replicating the survey-based results, the largest that we find developing world poverty to be in 2010 is 12%.
Read more from Reason.com on poverty here.


Show Comments (119)