Subscribing to Success
How to figure out financial newsletters
If you were to walk in on the middle of a poker game and bet on which one of the players would eventually win, which would you choose? Should you automatically bet on the player with the highest pile of chips in front of him? Not necessarily. You would want to know whether he had won them all in one lucky round after losing in every other. If that were the case, you would probably not choose him but a player who had a more consistent record of less spectacular winnings each round. Considerations such as this would be crucial to making an intelligent bet about which of the players would win in the end.
Unless you enjoy losing sleep at nights, the same considerations are important in choosing an investment advisory newsletter. Yet, curiously enough, when it comes to choosing an investment strategy, many people do not consult their sensible instincts that would protect them so well in gambling. Instead of asking which advisor has the most consistent record, too many investors want to know which one has made the most money, period. Too few of them realize that winning the Irish Sweepstakes would provide them with larger winnings than virtually any found in the stock market, but that does not mean you should invest your company's pension in the Irish Sweepstakes.
Consistency and risk are two sides of the same coin: the more consistently a portfolio performs, the less risky it is. An understanding of the relationship between risk and return shows why consistency is a virtue. Of two portfolios that have performed similarly over a period of time, the one that did so with the least risk (that is, with the most consistency) would be the better bet for future performance. Conversely, of two portfolios with the same degree of risk (that is, with equal consistency), the one with an established record of greater performance would be the better bet for future performance. To choose otherwise in examples such as these would mean that you were needlessly sacrificing security or performance for nothing in return.
One measure of consistency and risk is the standard deviation, the measure of how far a portfolio deviates from its average performance level. A higher standard deviation indicates greater volatility; a lower reading, less.
To illustrate how this is measured, suppose that two newsletter portfolios each had average monthly gains of 10 percent in January and February. However, if the first newsletter made 5 percent in January and 15 percent in February, its standard deviation would be five. And suppose that the second portfolio made 10 percent in January and 10 percent in February. Its standard deviation would be zero—no deviation from the monthly average, hence no volatility and far less risk than the first portfolio.
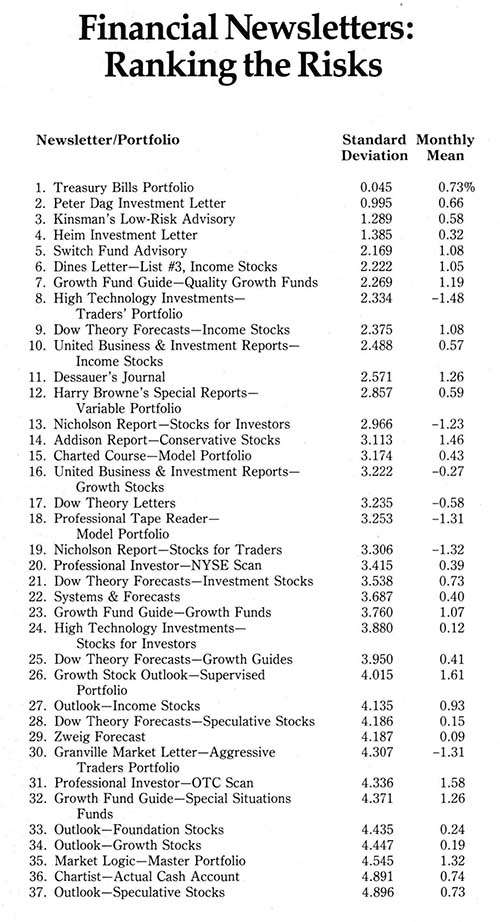
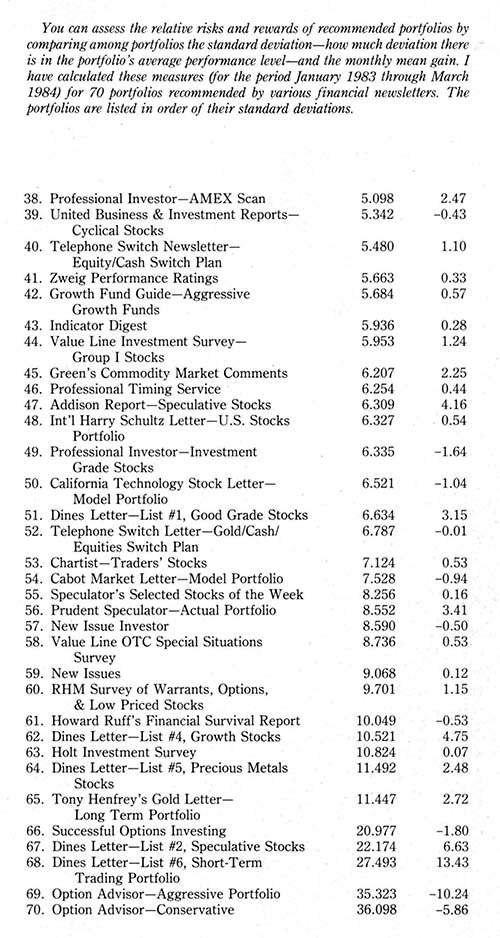
The table on the next two pages ranks portfolios recommended by some of the better-known newsletters according to the standard deviations of their monthly performances from January 1983 through March 1984. (In those cases where a specific model portfolio wasn't published by the newsletter, I have devised a portfolio for it based on the newsletter's recommendations and using methodology formulated by the Hulbert Financial Digest.) Those at the top of the list—the ones with the lowest standard deviations—were the least risky and the ones at the bottom were the most risky.
In addition, the average monthly performance of each portfolio is listed. With this data, one can see which newsletters' portfolios at each risk level made the most money.
At the top of the list, for example, is the "T-bill only" portfolio, indicating how much profit and how much risk would have been associated with investing merely in Treasury bills from January 1983 to March 1984. The very low standard deviation shows that such a strategy entailed very little risk, and the monthly average performance of 0.73 percent is known as the "riskless rate of return." At the bottom of the list, in contrast, are several portfolios made up of options—and their very high standard deviations suggest the riskiness of investing in options.
A cursory overview of the list is all that is needed to discover that newsletters vary widely in their ability to exploit risk efficiently. If all newsletters were equally efficient in this respect, then the average monthly performance for their portfolios would grow just as their risk levels (that is, their standard deviations) grew. But in fact some of the portfolios with the most risk actually lost money—and fewer made even as much money as a portfolio parked in Treasury bills, with the riskless rate of return.
So how can you use this information on portfolios to help you select a newsletter? First, you can eliminate many portfolios from the list of those you might subscribe to. For instance, if a portfolio makes the same amount as another but it entails greater risk, it can be crossed off. For an example from the table, compare the High Technology Investments investors' portfolio (24) and New Issues (59). Both have had the same average monthly performances—0.12 percent—but different standard deviations. High Technology Investments' standard deviation is 3.88 and New Issues' is 9.068. Thus, the former newsletter would be preferable.
In addition, if a portfolio makes less money than another with the same risk, it too can be crossed off. Compare the Granville Market Letter (30) and Professional Investor's OTC portfolio (31). Both have similar risk levels, but the Granville Market Letter portfolio lost an average of 1.31 percent each month while Professional Investor's OTC portfolio made an average of 1.58 percent each month during the same period. In this way you could eventually narrow the list of newsletters down to those whose performance and risk measures roughly corresponded.
You still would not have narrowed down your list of potential letters to just one, however. Why? Because no amount of performance-based research can decide for you how much risk you are willing to tolerate. That decision is yours alone. Are you investing assets that you could afford to lose? If so, you would look for a newsletter with high risk levels. However, if you are investing assets that you cannot afford to lose and are looking for income more than for capital gains, you should look for a strategy that incurs low risk.
This is why it is misleading to ask which advisor is the best. Different newsletters may be equally good in different areas, but you have to choose which area. Performance-based research can only help you choose which newsletter is the best once your own investment goals have been chosen.
Let me give an example from the table. If you look at the six portfolios recommended by the Dines Letter (6, 51, 62, 64, 67, and 68), only one of them—Dines's list 5, of precious metals stocks (64)—would be crossed off the list by the analysis discussed earlier. This particular portfolio has higher risk and lower performance than some of Dines's other portfolios. The other five would remain as viable selections, so the choice among them would be yours. If you were looking for income and wanted to incur little risk, you could choose Dines's list 3, in the sixth position on the table. Or you could select one of the other remaining Dines portfolios, each of which would entail greater risks but would also have records of greater performance. Dines's short-term trading portfolio, which has included mostly options over the past year or so, would be your choice among the five if you were going for the greatest risk.
These are some of the major considerations you should keep in mind when choosing among various investment newsletters. The next time you receive a mailing advertisement promising thousands of percent profit in your spare time (I receive literally hundreds of these ads every year), do not ignore your instincts that would protect you against similar claims in a gambling casino. Remember that even the winner of the Irish Sweepstakes easily could make the same sort of pitch and should be ignored by the prudent investor. After all, making money requires rational, not emotional, analysis.
Mark Hulbert is editor of the Washington-based Hulbert Financial Digest.
This article originally appeared in print under the headline "Subscribing to Success."


