The Volokh Conspiracy
Mostly law professors | Sometimes contrarian | Often libertarian | Always independent
Coronavirus Deaths Return to March/April Levels in Europe, U.S.
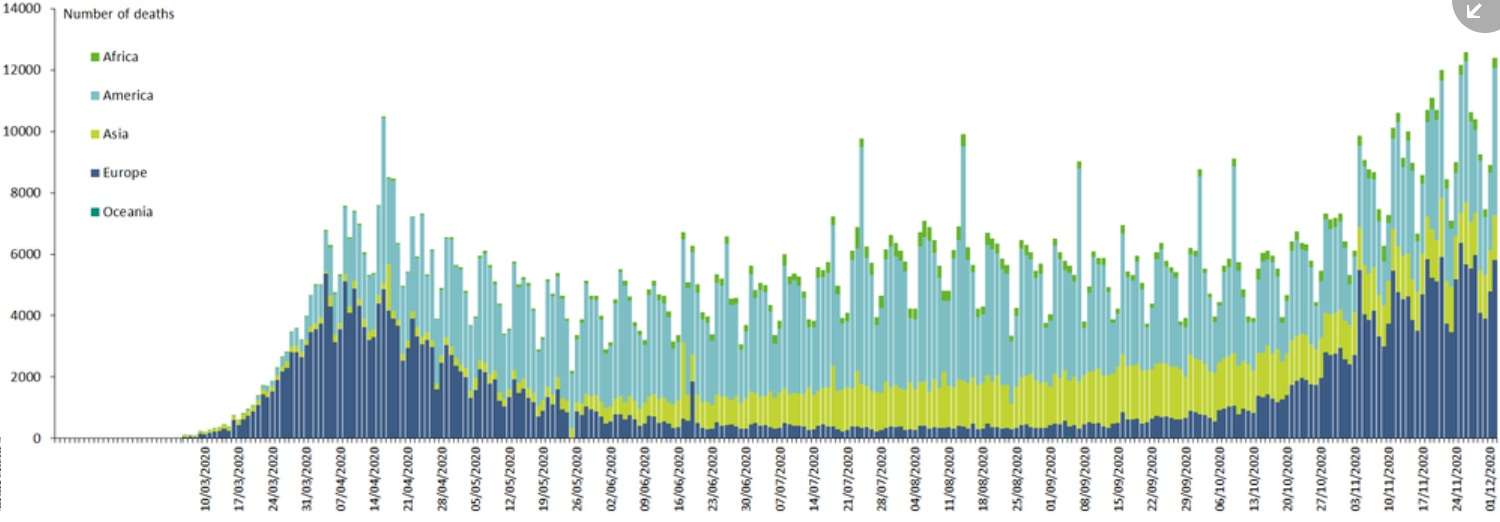
Here is the data from the Europe Center for Disease Prevention and Control; the blue bars are the totals for Europe (note that the dates are in the European format, DD/MM/YYYY):
And here is the data from Worldometers site for the U.S.:
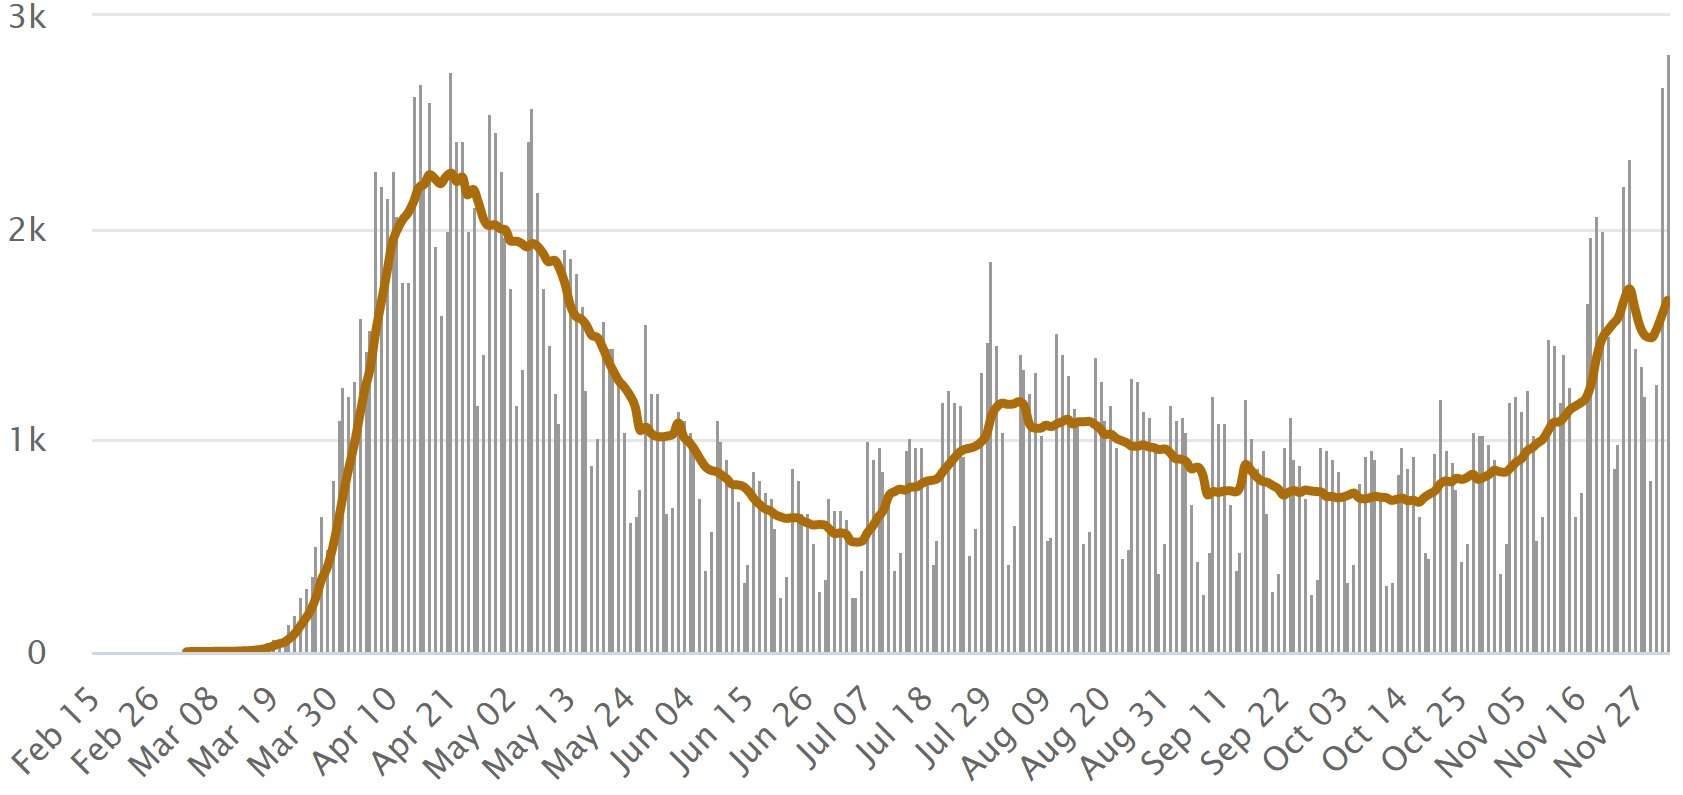
As you can see, the U.S. daily numbers (the grey bars) are comparable to the April peak, though the 7-day rolling average (the brown line) isn't yet up there. The per capita numbers in Europe (which has a population of about 2.25 times the U.S.'s) are a bit higher than in the U.S., though over the Summer they were much lower. Let's hope those vaccines we're hearing about are coming soon ….
To get the Volokh Conspiracy Daily e-mail, please sign up here.
Editor's Note: We invite comments and request that they be civil and on-topic. We do not moderate or assume any responsibility for comments, which are owned by the readers who post them. Comments do not represent the views of Reason.com or Reason Foundation. We reserve the right to delete any comment for any reason at any time. Comments may only be edited within 5 minutes of posting. Report abuses.
Please
to post comments
I think it’s worth pointing out that the states that were hardest hit early on are NOT seeing any real second peak. The second peak is only showing up in states that did fairly well in early suppression efforts.
This suggests that Covid deaths in each state will probably all converge on roughly the same number eventually, barring an effective vaccine being distributed sometime soon.
The people in the Northeast would beg to differ with you; see this daily dataset showing rising rates across New England: https://www.nytimes.com/interactive/2020/us/coronavirus-us-cases.html?action=click&module=Top%20Stories&pgtype=Homepage
That’s a common mistake: Those are “cases”, which is to say, positive test results. They reflect some combination of the underlying infection rate, the number of tests being done, and test selection criteria.
If you follow your own link, and go down to the two graphs, “New Reported Cases per Day”, and “New Reported Deaths per Day”, you can see this clearly: The highest death peak is in April, the highest test peak is in November.
Let’s be concrete: The four hardest hit states were New Jersey, New York, Massachusets, and Connecticut. With total deaths per 100k ranging from 192 in New Jersey to 141 in Connecticut.
Look at the numbers for New Jersey. Look at the Daily reported new cases and Daily reported deaths graphs.
Cases shows a huge peak in April, and an if anything higher peak now.
DEATHS shows a hug peak in April, and barely twitches Now, a tiny fraction of April’s deaths.
Why the contrast? Because “cases” is a lousy measure of how bad a pandemic is, unless you’re testing a representative sample of the population at random. The first peak in “cases” was a low level of testing, at the worst of the pandemic. The second peak represents a very high level of testing, but the pandemic mostly burned out. You’ll see the same pattern in other states that were hard hit.
Now, use the same site to look at Nevada, which got hit about a quarter as hard. There you see a small peak in April, (Essentially travelers who passed through NY when it was bad there!) and larger peaks August and today. They’re suffering today because they didn’t kill all their vulnerable people back in April, essentially.
The first peak for the nation-wide numbers is the NE getting hit really hard. The second peak for the nation-wide numbers is the rest of the country, that did a better job of “flattening the curve”, seeing a late surge because they’re still full of people who could be killed by it, and are nowhere near herd immunity.
“but the pandemic mostly burned out.”
This is a bogus observation. It is reflected only in the strong decrease in case fatality rate that has fallen primarily due to catching infections early through testing and very importantly avoiding serious errors in treatment that were prevalent in the spring
Right.
You can’t just compare deaths in the aggregate. Improved treatment matters, as does a change in the demographics of the patients – younger patients are much more likely to survive, of course, and it seems that the current wave is hitting younger people harder.
Nor did the NE “kill all their vulnerable people back in April.” Total deaths in NY are about 35,000, or less than .2% of the population. Lots of vulnerable people are still alive.
Brett – These are the same people who can’t understand statistics relative to the Joe BiteMe election fraud.
If they can’t understand what’s inherently problematic when, say, 100 eligible people cast 600 votes, they aren’t going to understand that number of positive tests will inherently increase as sample size does, even if percentage decreases. Massachusetts recently had to renorm its color code for communities for this reason.
Remember too that mortality ONLY means a positive test in the morgue — someone decapitated in a motorcycle crash died from that, not COVID, notwithstanding a positive test.
And there is an argument that the test is generating a lot of false positives.
Ed, you’re buying into made up election bullshit. If they had and evidence of anything of substance they’d have made it public by now. There is no jurisdiction anywhere in which more votes were cast than there were eligible voters to cast them. This is stupid and harmful.
After this hogwash has cost us a gridlocked government, I hope you enjoy tried into Progressiveland.
https://videos.whatfinger.com/2020/11/30/top-10-memes-servants-of-providence/
What’s stupid and harmful is the conspiracy of censorship.
And if you want to talk “gridlock”, wait until the National Trucker’s Strike in protest of Bite-Me’s Inauguration, if it comes to that….
Prepare to welcome your DC brethren to statehood!
The hearings to confirm the new progressive judges on the new Supreme Court will be very entertaining.
You’re gonna need to be careful what you post online though. The new hate speech codes are gonna be pretty tough.
Preach on, brother Bevis
Bevis, do you honestly think the Dems can get along with each other?
I don’t — the House alone is split at least three ways if not four — remember AOC and Amazon?
Want real evidence: https://youtu.be/nwHa1pfyJjc
130% of registered Democrats voted for BiteMe.
Worst than that he is buying into a bullshit version of epidemiology.
Every responsible medical researcher knows about the uncertainties and even the systematic biases in SARS-CoV-2 infection data. And they apply that knowledge into understanding the dynamics and the virology of the disease
MM- IFR are not rising, at least not significantly, the NE states
check worldometers or john hopkins or 91-divoc . com for better analysis than is available at the NYT.
Brett’s statement is a reasonable assessment of the current state of affairs.
Of course not joe
The IFR are approaching their “natural value between 0.5% – 1% world wide controlling for demographics.
So your observation is not very revealling
Brett,
The statistics of California belie your claim to a gross extent.
New York does follow what you suggest but MA, NJ not so much.
I’m looking at the numbers for California as we type, and it clearly confirms my thesis.
1. California was not badly hit. 49 deaths per 100k population, cumulative. Barely more than a quarter of NJ’s deaths.
2) Daily reported cases peaks at about 10,000 in late July, and again at 15,000 now. Looking at “cases”, things look worse than ever!
3) But daily reported deaths peaked at ~80 in April, ~140 in August, and are currently only at 70 or so. Things clearly are NOT worse than ever.
My thesis has two points:
A: “Case” rates are a piss poor measure of the pandemic.
B: States that were hit hard early on have burned through the pandemic, and are no longer at risk of significant peaks.
Which is great for the NE, (Except for all those dead people, obviously.) but not so great for the rest of us.
While cases can be misleading because we aren’t sure how much is due to the level of testing, that confounding factor can be accounted for in the positivity rate. It’s possible CA is seeing more cases now (after accounting for testing level) with lower deaths because of better treatments, while other areas are seeing higher deaths because they saw very few cases to begin with.
Yes, improved treatment is the obvious thing missing from Brett’s analysis and provides for a much better explanation than differences in testing.
Also, deaths are a lagging indicator relative to cases and they are clearly on the upswing in many places that have seen a substantial uptick in cases a month or two ago.
That is correct, jb.
Deaths lag by at least 2 weeks.
And Brett’s blah-blah assumes that if you don’t die there are no lasting effects. Again very sadly incorrect.
Brett doesn’t care if someone dies from COVID. He most certainly doesn’t care about those who don’t die, but have lasting consequences from their illness.
He’s a mini-Trump – as long as he can claim to be right about anything, he’s happy.
Since treatments are widely published and shared across the states, I see very little evidence that better treatments are at all relevant to the patterns.
That is, if better treatments were relevant to the analysis, you would not expect to be seeing to current spike in deaths in states like Nevada. When you consider all the states’ data, the pattern is more consistent with Brett’s hypothesis that we could (and sometimes did) flatten the curve but that nothing we are doing has changed the total area under the curve.
This sounds harsh but the majority of those who are susceptible to this virus will eventually die of it no matter what we do (ignoring vaccinations which do not yet exist and therefore are not relevant to the analysis above).
Cases in CA are about 1.5 times greater than in the first wave. Cases in NV are about 3 times greater.
Better treatments may be mitigating those spikes, though, meaning that if we were still using the treatments from March and April, they would be even higher.
I think the best apples-to-apples comparison is hospitalization rates.
Although NYC is trending worse, it is nowhere near where it was back in March and April. Back then, we had 24 straight days with 1000+ new hospitalizations, peaking at 1835 on March 30. Currently, the numbers are increasing, but have not even broken 150.
https://github.com/nychealth/coronavirus-data/blob/master/trends/data-by-day.csv
I think the best apples-to-apples comparison is hospitalization rates.
^ This.
“ignoring vaccinations which do not yet exist”
That is a weird statement, since the UK has approved a vaccine and there’s emergency applications in for approval for two vaccines in the US.
As for the rest, lowering CFR by improving treatment doesn’t prevent spikes in deaths, it just explains why deaths are relatively lower relative to cases than they were in the spring. Looking outside the US, Belgium is the obvious disproof to Brett’s thesis–it’s absolutely possible to have a lot of deaths in the spring and then another one in the fall, and the total per capital deaths can be way higher than we’ve seen anywhere in the US.
No, vaccines exist. Vaccinations do not yet. Vaccinations do not exist until vaccines have been produces, distributed and applied in statistically significant numbers. Approvals of vaccines means that vaccinations may be available in the near future but they are irrelevant when evaluating past data.
And while Belgium may be a contradictory data point, it’s only a single data point. That alone is insufficient to disprove Brett’s hypothesis.
I think you and I have a different definition of “exists”. You seem to think it means “has occurred at large scale throughout society”. I think it means “exists”.
(Hint: the people in vaccine trials have already been vaccinated.)
“the majority of those who are susceptible to this virus will eventually die of it”
Absolutely wrong with NO data whatsoever to support the claim.
It has been hit badly since June. Your politics are clouding your ability to analyze statistics.
Your thesis is bogus and dangerous.. As many countries have shown.
1. Keep fragiles safe
2. Let it spread until herd immunity
3. Do not overwhelm ICUs
4. Hope for a vaccine
Everything else is just clown blabber. This continues to be the actual game plan since day 1.
Again, the rest is just blabber.
This is the game plan we have been following? And, it is going to result in 300K, or perhaps 400K deaths. What a lousy game plan.
Sometimes all the possible plans are bad.
Apparently, New Zealand, Australis, Japan, South Korea, Thailand and Vietnam each came up with a better game plan.
3 islands and Korea with a hard NK border is effectively an island. Different dynamics completely than a continental nation with long borders with neighbors.
Communist dictatorship and a Royal military dictatorship both lack freedom and tranparancy to know if they are telling the truth.
Our peers in Europe are worse or just slightly better.
I think the big factors in success in Asia are tight borders along with comprehensive testing and tracing. Germany and Canada are quite a bit better as well.
Germany and Canada are doing better than New York, New Jersey, Connecticut and Massachusetts but the other 46 states are insulted that you lump them in with everyone else.
In deaths per capita, Canada and Germany would rank 46th and 48th out of 51 (including DC) respectively.
Josh wants our government to act more like North Korea.
Hmm, so we secretly adopted the Swedish plan without telling anyone?
Brett’s thesis is incorrect.
Belgium had the highest covid death rate of any country back in April (4 times greater than the US death rate), and then Belgium had another surge in covid cases in October/November (6 times higher than the US) and covid deaths (5 times higher than the US).
Spain also had a very high covid death rate in April, and then had another surge in covid cases and deaths during the past several months.
I took the Worldometers Covid data by state and then did a correlation between the tests, cases and deaths per 1m people, just to see whether the number of cases was dependent on how much testing was done it wasn’t:
tests/cases -0.0987513478
And there was almost no correllation between
cases/deaths 0.3200346792
Maybe because the first wave was so much more deadly than the second wave.
That wasn’t very satisfying, so I looked for lockdown data by State. Wallethub has a 50 state numerical rating, the more open the state the higher the score. For Instance CA is a 21 and FL is 67. That seems about right to me.
So then I correlated lockdown strength with cases and got the strongest correlation so far
lockdown/cases 0.6945994259
So the tighter the lockdown the fewer the cases, and that seems to settle the argument.
But then I correlated lockdown strength with deaths and there is absolutely no correllation:
-0.07417079519.
So there you have it, lockdowns may reduce the number of cases, but they don’t save any lives.
Anybody with about 30 minutes on their hands can easily duplicate my calculations on a spreadsheet using the Wallethub lockdown metric and the Worldometers state by state data, so if you don’t believe me, show me where I got the calcs wrong.
“But then I correlated lockdown strength with deaths”
Are you using total deaths, that have occurred over months, with current lockdown data? At least locally, the official lockdown policies have varied quite a bit over time.
I haven’t looked closely at the timelines, but how many of the early surge in deaths in say NY were infected before the lockdowns etc were started? If you think about the timing, if a nursing home worker is infected at the grocery at time 0, and weeks later infects patient zero in the nursing home, who some time later infects … there can be a considerable lag between adopting a policy that would have kept the original worker from getting infected and the last death resulting from that original infection.
Another confounding factor is that what the governor says, and what people do, may not be highly correlated.
(heh … what the governor says, and what the governor does, may not be well correlated either, unfortunately. You’d think some of them would resign in disgrace.)
I gave some thought to the fact that lockdown strength has gone up and down over the course of the pandemic, but for the most part governors that have favored strict lockdowns have been quick to ratchet up the lockdowns, while governors that don’t favor lockdowns have been slower to start them and quicker to lift them.
These correlations are hard to reconcile.
They seem to suggest that lockdowns reduce mild cases, but not serious ones. Is there another explanation?
Did you just use aggregate data over the course of the pandemic?
It seems possible that the lack of correlation between deaths and lockdowns stems from the early part of the pandemic, when the NE was very hard-hit and the lockdowns were not yet in place.
So I tried eliminating those states and the correlation improved, but only to about .22, which is significant at the .1 level, anyway.
This University of Kansas Study heavily promoted the value of masks –
“Kansas counties that had a mask mandate had a 50% reduction in the spread of COVID-19 when compared to those without, according to a study by the University of Kansas Institute for Policy and Social Research. Mandates don’t affect people’s mobility. BY UNIVERSITY OF KANSAS INSTITUTE FOR POLICY AND SOCIAL RESEARCH”
I contacted the institute which provided a link to the source data.
The actual data shows less than a 15% reduction by wearing a mask.
For the period July 3, through Oct 23rd, the delta was 11% fewer cases in the mask mandated counties vs the non mask counties.
For the period August 1, through oct 23rd the delta was 13% fewer cases in the mask mandated counties vs the non mask counties.
It was only for the period of Oct 1 through oct 23, the delta as approx 50% fewer cases.
A spot check of approx 25 counties from the period Nov 1 through Nov 14th, the delta was approx 16% fewer cases in the mask mandated counties vs the non mask counties.
I sent an email pointed out their misrepresentation of results and if they would update their study to cover the subsequent 4 weeks showing a much smaller data. I have not received a response.
Trump’s silence continues to be deafening. The virus and its ever rising hospitalization and death toll are not fake news. He can’t change the outcome of the election he lost, but he can still encourage people to follow public heath guidelines as the next holiday season approaches. But that would be so out of what passes for character.
Yeah, it’s vitally important that we all stay in during Christmas week so as to keep the roads and airports clear for all the governors and mayors and councilpersons to more easily travel to visit their families.
You nailed it. The hypocrisy of those people is sickening. I don’t care what team you’re on (Team D, Team L, Team R)….If you make the rule, then live by it like the rest of us.
I wholeheartedly agree.
It’s too late for that. The “Backfire Effect” has taken root and no amount of facts, logic, or evidence will persuade his supporters to change their behavior. Attempts to do so only make them dig in deeper and cling to their erroneous beliefs more strongly.
https://daily.jstor.org/the-backfire-effect/
Yup. Trump should tell people to stay indoors, and then go to the French Laundry or Cabo, just like the rest of the politicians.
Michael,
Unfortunately the virus now has its own dynamic. There is little that DJT can do, and moreover, no one would listen to him now. The lesson of CA is quite instructive. We have had some level of lockdown since mid-March, a mask mandate since mid-June, a curfew for two weeks and yet the case load keeps rising.
Because the testing rate keeps rising.
No Brett, that only accounts for 30% of the rise.
Brett, that is nonsense, unless you characterize medically the people tested, and characterize sociologically the political jurisdictions in which the testing is done. Massachusetts publishes town-by-town data on all the relevant indicators, including testing. Looking at those data, it could not be more evident that different sociological conditions, combined with different testing regimes, lead to different medical postures, lead to different meanings for testing data in different places.
No one-theory explanation can account for the fact that some of the towns with low testing rates experience some of the highest spikes in infections, while other towns with the highest testing rates in the state show some of the lowest rates of infections. Yet, among other groups of towns, those rules seem to be reversed. Much seems to depend on differences in testing tactics and testing policy.
The first-impression statistical picture is a mess, and can only be explained, if at all, by case-by-case examinations of differing town testing policies, and differing risk profiles owing to differing sociologically-linked exposure profiles among the towns.
There is no reason at all why those factors and variations which operate among the towns of Massachusetts will not prove similarly confounding when looking at data across the U.S.
My general suggestion is that folks who suppose fatalities are a lagging statistic are right, and that many fatalities from the November surge have yet to be heard from. Multiple factors compound that lag. First are the medical ones, next come the administrative ones, and sometimes the political ones. It takes varying amounts of time—from infection, to medical deterioration, to death, to become a reported statistic.
Also, some political jurisdictions have apparently been fudging their numbers, trying to keep the counts looking low. To find those out will require a still-longer view, arrived at by measuring excess deaths in retrospect.
What that all may add up to is a conclusion that, for instance, a two-week lag in reported death rates behind reported infections, is far too optimistic. Even a six-week lag will not capture all of them.
What could not be more obvious is that Covid-19 has strewn corpses throughout the nation at a rate higher than any medical occurrence reported at least since the Spanish flu. For a time, it seemed that some political purpose was being pursued by those trying to minimize recognition of the damage. What accounts now for continuing to minimize is hard to understand. Why do you do it?
Brett see above where I did a correlation between tests 1m/cases 1m by state. More tests have no correllation with the number of cases. My theory on why that would be is that the governors that made the funds available and emphasized widespread testing probably had no correllation with the states being hit the hardest. Or perhaps the early waves hit before testing was widespread.
Kazinski,
We should also realize that since mid-September the number of tests has increased significantly by certain populations being tests 2or 3 times per week. So the numebr of infections per 100K tests is going to decease.
That was not the case prior to mid September when increased testing account for between 20% and 30% in the increase in the number of cases.
Perhaps the mitigation efforts don’t make a difference. Or perhaps they do, but every time we ease back on them, the virus reemerges. Or perhaps, the public isn’t sufficiently following the mandates.
No matter which of the above is true, delaying the virus outbreaks saves lives thanks to better treatments and hopefully the upcoming vaccine.
“No matter which of the above is true, delaying the virus outbreaks saves lives thanks to better treatments and hopefully the upcoming vaccine.”
Kind of depends on the extent to which the efforts to delay the virus outbreaks increases other death rates. The delays in elective procedures to preserve space for expected Covid patients look to have significantly increased heart attack deaths this year. It will be a couple years before we have good numbers on what it did to cancer deaths, but I’m not terribly optimistic on that front, either.
Citation for the increase in the absolute number of heart attack deaths?
See, for instance: Heart conditions drove spike in deaths beyond those attributed to covid-19, analysis shows
We know from the CDC (see Table 1), there have been about 283K excess deaths in 2020. What I am unable to figure out from your data is how many are due to more heart disease deaths than expected.
According to this website, there have been about 543K deaths from February 1 through November 21, 2020 from heart disease. That projects to an annual total of about 680K. The CDC says about 655K die each year from heart disease. So perhaps, we have seen an increase of about 25K deaths from heart disease.
I think in many cases, all it did was move deaths up a bit. This does represent a real hit in terms of man-years of life, but in the case of people who were going to die soon anyway, not a huge one.
Of course, in a trivial sense it’s all moving deaths up…
Did you just downplay 283K excess deaths?
No Josh, he didn’t. But the fact is, if COVID kills a 94 year old in 2020, who otherwise would have died in 2022 at age 96, we’ll now have one fewer death in 2022.
This isn’t rocket science, and it doesn’t mean that a 94 year old may have lost years of his life that would have been a high quality of life. But it does mean that they were simply frontloaded a little.
Or this: (It’s not limited to the US) Heart disease deaths soar in England during Covid pandemic.
Or this: Out-of-hospital cardiac arrest survival fell 17% amid COVID-19
“The authors noted that the proportion of witnessed OHCAs, bystander cardiopulmonary resuscitation or defibrillator use, and median time from 911 call to emergency services arrival were comparable in both years and thus could not account for their findings.
But reasons for the results could include the large decreases in hospitalizations for heart attack, heart failure, and noncardiac conditions in the pandemic and delayed care due to fear of infection, which may have boosted at-home cardiac arrest and death rates, the researchers said.
They added that the low ROSC rates could have been the inadvertent result of Centers for Disease Control and Prevention and American Heart Association COVID-19 protocols meant to protect healthcare workers.
The guidelines call for screening 911 calls for likelihood of patient coronavirus infection, limiting the number of emergency personnel at the initial response, pausing chest compressions during aerosolizing procedures such as intubation, limiting bag-mask ventilation if specialized filtration isn’t available, and not taking patients to the hospital without ROSC.
“Many of these recommendations are believed to be essential for protecting frontline health care workers from unnecessary exposure in communities severely affected by the COVID-19 pandemic but may also decrease the likelihood of a successful resuscitation,” the authors wrote. “Whether these recommendations may have been implemented more broadly [in] communities severely affected by COVID-19 and whether such practices affected rates of successful resuscitation deserve further study.””
Brett, here you have a useful point. Namely that lockdowns have prevented care (including major surgeries) that have or will lead to death. So there is a real cost in health outcomes to rigid lockdowns, a fact that some advocates of rigid population controls prefer to ignore.
OTOH, if hospitals are overloaded then you are obviously going to see an increase in heart attack deaths and others. The issue is why these deaths have increased. The assumption that the lockdown itself somehow caused them needs examonation.
Of course, the whole point of Brett”s work here is to argue that there was absolutely nothing Trump could have done to prevent even one or two deaths.
Bernard111 comment – “Of course, the whole point of Brett”s work here is to argue that there was absolutely nothing Trump could have done to prevent even one or two deaths.”
Presidents typically dont have much power over mother nature – So not much that Trump or any other president could done. The USA results were very comparable to the rest of Europe.
Though if Trump screwed up, it was not stopping coumo from sending covid infected patients back to nursing homes
The most significant and actually tabulated impact has been the long postponement for 3 to 5 months if not cancellation of cancer surgeries.
Josh,
Have you ever observed they way people wear masks? They are constantly touching, raining and lowering, and then in places like supermarkets touching items on the shelves on which fomites can survive for 2 to 3 days or even more.
When people do such things, they aren’t exactly following precautions.
Trump?
While the bully pulpit is useful, there are 314,999,999 other people in the US, and 50 state governors.
Why are we all standing around like idiots doing nothing?
Oh wait, we aren’t.
You should be thankful whenever Trump is silent. I hope Biden will be silent, too, but that’s doubtful.
Eugene, you need to look separately at “case” and “death” rates, they tell different stories.
The “case” rates are great if you want to scare people, but they’re a lousy measure of what’s going on with the pandemic, because the rate of testing, and the criteria for who gets tested, have varied hugely over the course of the year. And both of those directly influence the “case” rate, which is just the number of positive tests.
Can’t test positive if you’re not tested, after all!
As I suggested to Michael, look at the contrasting graphs of “case” and “death” rates in New Jersey, and you can see quite clearly that “case” rates are a terrible measure of the severity of the pandemic.
Can positive tests be an indicator for the number of cases currently going around in any one particular area? Sure. Do we know how to extrapolate an accurate number using positive case results? Not really. The best we can do is say “yup they are going up” or “no they seem to be going down.” Or the equivalent of looking outside and saying whether or not it is cloudy.
” the antigen test has an accuracy of about 30% for those who have no symptoms.”
That’s 70% false positive — aka bogus data…
https://dfw.cbslocal.com/2020/11/17/fda-covid-19-rapid-antigen-tests-can-give-false-positive-results/
“Eugene, you need to look separately at “case” and “death” rates, they tell different stories.”
FWIW – I personally know 25+ individuals who have caught covid, The worst case was one individual who ran a 102/103 fever for 4-5 days. all the others had few symptoms or only ran a 100/101 fever for a day.
I know somebody that caught Covid and died. We’ve all got our anecdotal stories it they shouldn’t be the basis for how we handle the disease.
Just because your smoke detector goes off doesn’t mean your house is on fire — usually it isn’t.
Some will die, even in the non-fragile zone. Sucks, but it will happen until A. Herd immunity or B. Vaccine.
And in a country of this size, 1/2% of non-fragiles is still a large absolute number.
It’s silly to worry about the inevitable, though. Keep in mind much medical research is on hold, and not just because some is diverted to COVID. 8 months and counting means 8 months of people continuing to die from stuff that would have become better treatable otherwise.
A halfway decent heart disease or cancer or diabetes treatment could save 50,000 lives a year in this country alone. That shouldn’t be compared to total COVID deaths, but to excess deaths due to a sloppy job. I find it doubtful numbers are way off from a theorerical Hillary presidency, assuming hers would even be less.
bevis – nor should we use someone else’s anecdotal story as the basis on how we handle the disease.
The numbers are all over the place but if you get Covid AND have no other complicating factors there is around a 90% probability that it will be a moderate case with symptoms for upwards of a week. In the other 10% though (or with other factors) it can be severe resulting in even death.
I would prefer not to get infected and find out where I fall on those probabilities, but from a public health prospective we should recognize that these rates.
The numbers are all over the place but…[makes assured statement with specific quantities]
Dude.
Does the concept of extremely low fatality rate mean nothing, or is it simply an in-group tendency to panic?
‘Extremely low’ is a valuation that is not shared by most of the world.
One way you can tell is Jimmy spinning nonsense numbers from crap data to try and make it seem a bit less like his (and your) subjective take.
If you need to insist that the rest of the world has been panicking for like 9 months and you and a few others are the only ones sober enough to realize it’s actually a conspiracy to take away your liberty, consider that it’s not them, it’s you.
It’s pretty well established that the CFR is <4%, so it's entirely unsurprising that in a population of 25 people with Covid, none of them died.
Only something like a third of shooting victims die. If I knew two people who had been shot and survived, that probably wouldn't convince me that getting shot wasn't a big deal.
One of the things that is different about the stories they tell is that deaths lag infections by 4 to 8 weeks. So the huge increase in cases over the last 3 to 4 weeks in, say, NJ may be because NJ has increased testing five-fold over the last month, or because the infection rate has actually increased, or some combination of the two. And if new infections are actually increasing, we can expect more deaths in a few weeks.
Deaths that were often caused by other stuff, COVID just exacerbating the other, inevitably fatal, condition(s).
For example, Walter E. Williams died yesterday — reportedly from Emphysema & COPD, the third largest cause of death in the US. For him, or Rush Limbough (Stage 4 lung cancer) COVID would be fatal, but not the actual cause of death.
Yet COVID would be listed in either case, QED bad data.
The brute fact is ICUs are close to being overwhelmed, and that’s with all the emergency expansion going on. (We will skip for now the mass murderous socialist impulse for “certificates of need” for hospital beds and expensnive medical equipment.)
In a sense, positive test results and even deaths are irrelevant, aside from potential excess due to ICU shortage. The fact is ICU clogging shows something huge is going on. That’s the only real indicator.
Overwhelmed ICU hospital hospitalization?
do you find it odd that it is relatively easy to find covid hospitalization rates during 2020, but hard to find total / non covid hospitalization rates for 2020 or prior years.
Most recent data was hospitalization rates of 9 per 100k at end of nov 2020 for covid vs 7 per 100k in the spring – not that much of a record increase.
We need to be able to compare all the data instead of selected cherry picked data
Except they’re not. Illinois hospital bed use has been constant all year despite change in occupancy percent due to covid. (Both all hospital beds and ICU beds). There was only a mild spike in May, otherwise its been stochastically flat the whole year, even despite increased cases in November.
Total bed usage is currently ballpark ~70%, and ICU usage isn’t that much different.
http://www.dph.illinois.gov/covid19/hospitalization-utilization
Gah, that should be ~80%. Typing quickly and off-by-one. Still not short on space – they’ve been at the same usage all year, pretty much.
Also note they added beds back in May, and then *removed* those added beds in late november – clearly illinois hospitals didn’t believe they needed the extra capacity.
Brett,
Indeed the fatality rates and infection rates are different indicators; in almost all countries the incidence fatality rate is dropped for the rates of the spring to the “natural rate” for SARS-CoV-2 infections, namely the range from 0.4% – 0.7% depending on demographics.
Yet you draw illogical conclusions. The rates were h
The rates were high due to lack of good information about how to treat patients, biases in identifying those infected, lack of early identification.
The infection rates have nothing to do with scaring people as you suggest.
I’m just saying that the focus on positive tests, without explaining that a lot of the increase is driven by changes in testing rates, is scaring people into thinking things are worse than ever. When they’re not nearly as bad as earlier in the year.
A lot is only 30% at most.
https://medrxiv.org/cgi/content/short/2020.09.30.20204990v1
I do not see that this paper makes that claim. Giving you the benefit of the doubt: you linked the wrong paper perhaps ?
Brett Bellmore: I do look separately at them; the graphs I give are the death rates.
Well, I feel stupid now.
Mind, I’m coming up on 62, I fully expect to feel stupid more and more often as the years go by.
These graphs are only as useful as the information is that goes into making them and the quality of that information is not great. Definitely better then nothing, but considering these numbers are being used to benchmark lockdowns and other policies that have huge economic implications that is scary.
Deaths with corona going up again. Scary. With the sharply rising popularity of tattoos, deaths with tattoos are also going up.
Majority of fatal auto wrecks involved licensed vehicles operated by licensed drivers. QED vehicle and driver licensing causes highway fatalities…
Steve McIntyre at climate audit . com runs a twitter commentary. Several months back there was a textbook written circa 1990/2000 documenting the history or influenza viruses throughout the world. (i dont recall the authors possibly boyles? – if anyone has the reference , please provide. )
One interesting aspect of the book along with many other textbooks on influenza is that the trajectory of covid in the various regions through the world is following a similar trajectory as most every other viral outbreak through history , albeit on a larger scale simply because of the novelty of covid, being a very new viral strain.
For example the current surge in Europe is consistent with the prior history, the same with the northern US states excluding the NE US, Several northern states wisconsin, ND, SD MT, Co are effectively having their first wave which started in sept. The late spring/ early summer surge in the southern US should have been expected as the july/aug surge in australia.
The village of Vo Euganeo in Lombardy, Italy, tested its 3000 residents. One hundred tested positive. Most were young and asymptomatic. They quarantined for 2 weeks. They ended the epidemic. Why is epidemiology from the 14th Century so hard to understand for the neo-Marxist leadership now controlling all Western countries, including the USA?
You quarntine the infected, that is also what the quarantine laws of the States say. You do not lock down everyone. The ensuing poverty will kill 130 million by starvation. The surge in Deaths of Despair has no lag in time in the USA. The surge of 40% in suicide, murder and overdose are here. The Democrat Party must be disbanded for this biggest mistake in human history. The deaths they caused are an order of magnitude greater than Stalin and Mao. They should be arrested and tried for crimes against humanity.
“The deaths they caused are an order of magnitude greater than Stalin and Mao.”
You are a fucking idiot.
130 million is a lot of deaths in months, not in years as Mao and Stalin caused.
1/3 of America is not going to die from starvation in the coming months.
People such as yourself should not voice your opinions, because they are universally idiotic and uniformed.
Your dispute is with the World Food Programme. I am repeating their conclusion. The Nobel Committee awarded them the Peach Prize for 2020. They are not a fringe group.
So Dems are going to cause global deaths now? Please connect the dots for me: Dem governor orders a lock-down….people die in India. Fill in the blank.
The incomes of the people in India went from $2 a day to much less. Your mass murdering lockdowns took $4 trillion from the world GDP, and people on $1-$2 have no edge left and fell off into starvation. The Democrat Party cause the biggest mass murder in history. The most conservative parties of Europe are to the left of our mass murdering Democrat Party.
The Peach Prize? I guess they must have used fuzzy logic in their analyses.
More or less we won’t know for decades — but there is morbidity, and will continue to be for decades.
Stunning rebuttal, you must win debates frequently.
If you think the dems are bad, you should check out the repubs. Started an illegal war based on lies that ended up directly killing hundreds of thousands, and may have killed over a million through indirect causes. They also were in control of most of the government during the onset of the last 2 recessions.
Oh, and repub governors are just about as prone to effecting lockdowns as dem governors. Turns out leadership all over the world, from commies to nationalists to liberals, tend to make similar decisions when faced with similar crisis problem sets. In this case, politicians would much rather close restaurants than explain to their constituents why the local hospitals are rationing care.
They are all imitating the Chinese Communist Party. They announced the lockdowns on loudspeakers in the street. No legal recourse. That is turning out to be true in the USA as well.
How are these lockdowns working for you neo-Marxists? You are bustin’ records in incidence of COVID. And how about those mask mandates, aren’t they effective?
Try returning to the epidemiology of the 14th Century, for a change of pace from you stupid Chinese Commie tyranny.
Take your meds, then we can talk.
Stop your stale KGB retort. It makes you sound stupid.
You’re certainly the local expert on that subject.
It was the CIA that claimed Iraq had WMD — just sayin….
Not true. Cheney and Rumsfeld decided Iraq needed to be invaded first, then went searching for cause later. Turns out you can cherry pick low confidence intelligence reports scattered over years to paint any picture you want.
Are you talking about the war that Joe Biden, Hillary Clinton, and other Dems also voted for and started?
Yes, I am. But what of it?
Are you supposing that that war would have started if Gore had been president, or if W. had simply said no to his war mongering cabinet?
I’m saying that Dems and Repubs are both bad, and both supported the Iraq war. Both party establishments should be destroyed, but they won’t, and nothing will get better as long as people keep getting tricked into just voting even harder next time and thinking that’s the answer.
Both bad does not mean they are equally bad.
Like I said, Gore would not have invaded Iraq. HRC would not have cut taxes and then proceeded to ignore a pandemic. These are things that republicans do and have done, and affect us greatly.
HRC cannot be assumed to have done any better than Macron or Merkel or the government of Belgium or the Netherlands. Don’t be pollyanna
Sorry, that’s delusional. HRC is a war monger and Trump was the first since Carter to not start a new foreign war.
Trump didn’t ignore the pandemic, just the opposite. He did too much. The briefings every day for seemingly forever. Doing everything exactly as putz Fauci directed. Pulling out all the stops on every single little thing — to the point that Cuomo and Newsom were singing his praises! Ventilators, emergency field hospitals, hospital ships — all over-produced by factors of 10 to 1000. And the worst — trillions of dollars in deficit spending. It would all sound like a leftist dream, if it weren’t the wrong guy doing it. The derangement is profound.
Yes.
Possibly based on believing lies told by Bush Administration officials, Colin Powell not least.
Massive testing and tracing likely would have been a better strategy. But, that would have required another Operation Warp Speed. Instead, the president’s attitude on testing ranged from indifference to hostility (it makes us look worse).
The success of Vo Euganeo was in the news in March, 2020. It was suppressed by the tech billionaire owned press. They scored an additional $trillion in profits over that expected. That explains everything, including all the failures of government.
It took a while for Trump to figure out that the CDC was incompetent, and the FDA was actively fighting to impede our response.
Yes, of course you are right, Brett.
Strongman Trump (smartest guy ever) is the reason we have such a great response. If it wasn’t for him, those stupid scientists and epidemiologists at the CDC and FDA would still be doing stupid science stuff, instead of just #winning.
Even now, Trump is saving us by endlessly searching his golf courses for the real killers, not the #fakenews Covid-19, which disappeared after the election.
Its OJ still looking for the real killers
The CDC testing snafu was back in February. Trump’s actions since then speak volumes.
Yes, and it put back testing efforts by months. As did the FDA’s opposition to private sector testing initiatives.
It was only a month ago that the FDA finally approved the use of at home tests.
It looks like the buck stops everywhere but Trump.
“If only the fuhrer had known about this!”
This is pretty much exactly it. We’ve got this ridiculous false dichotomy going on. If you think the virus is bad and you support absurd lockdowns of healthy people, you’re a Democrat, whereas if you say the virus is going away its own and we shouldn’t do anything, you’re a Republican. We need decent public health strategies and personal responsibility, not lockdowns, but what we’ve got is a lot of people who just don’t care because they don’t feel they’ll die if they get it because they’re 30 and don’t have health problems. If they give it to you, that’s your problem. Millions of people who are in the higher-risk groups are working in jobs where they’re exposed to the public, and many are showing up in the deaths and hospitalizations.
No one knows if each wave is the end or just another in a series of ebbs and flows. When you look at cases/hospitalizations/deaths in different places you’re comparing apples to oranges because they’ve all got different control measures in place.
Worst of all is the idea that the people dying don’t matter because they’re “half dead already.” I’ve had three friends die of this virus and they weren’t half dead before they got Covid, nor were they “falsely coded” with Covid after falling off a ladder or having a car wreck, as I hear people saying daily. Did that ever happen? I can’t say it didn’t, but the fact that we’ve had over 300,000 excess deaths in the US so far since late-January says the vast majority of these are not just other falsely coded deaths.
The excess deaths are concrete and measurable. One must subtract the deaths from increased suicide, murder, overdose, untreated cancer and heart disease. Coming in the near future are the deaths of children who did not get preventive care sucha as scheduled vaccinations. What is likely to be left over is something like the flu, 50000 deaths from COVID, like in your healthy friends.
2% of nursing home people die a month, around 30000/month. That should be deducted from the total death count. Naturally asymptomatic, infected young people were exempted from the Democrat travel ban, so they could provide intimate care in nursing homes. This idiotic mass slaughter is an all Democrat operation. It saved government a ton of money on Medicaid. The cheapest patient to Medicaid is the dead patient.
This Chinese Commie lockdown is the biggest mistake in human history. The Democrat Party must be held accountable and disbanded by the voters.
Poe’s law.
What is that? Some insult no doubt. Obviously not a lawyer. Have a blessed day, Sir.
Good points, but I can’t conclude that this is no worse than the flu based on the observed IFR of 0.26 percent (2.6 times as high as flu) in population-wide random studies of antibody prevalence in my state (Indiana) and the observation that hospitals have so many of these patients.
But let’s say the antibody studies are wrong and just agree for the sake of argument that any given person who gets Covid is no more likely to die of it than the flu, giving it a 0.1 percent IFR. The problem there is the flu spikes for a few months in winter and then dies down. These deaths have been occurring at varying rates since March. There were times they dropped a little closer to the top edge of the pandemic threshold but they never did come close to going below it – for nine solid months. My conclusion is that the real problem of this virus might not be its lethality but its transmissivity. You have more people getting it for a much longer period of time. And if it is more lethal, as the studies show, then that just makes it that much worse.
My comments refer in part to the last chart on this page:
https://www.cdc.gov/coronavirus/2019-ncov/covid-data/covidview/index.html
Corona:
2.6 times as bad as the flu, with a government response that is 1 million times as drastic.
Not to mention that the government response has in many cases made it worse.
“The problem there is the flu spikes for a few months in winter and then dies down. These deaths have been occurring at varying rates since March.”
It’s what we call in engineering a “startup transient”; Covid will probably settle down to a flu like seasonal cycle by next year, once enough people have developed resistance to it that it only successfully transmits under winter conditions.
Then the question is just how many people have gotten the virus and developed that resistance. If you take a conservative IFR figure of 0.26 percent (from the antibody prevalence study I cited above) and you look at the 285,000 known deaths, you come up with around 110 million actual infections, or a little more than seven times the number of known infections, and a third of the population. Earlier CDC estimates said the number of actual infections could be as high as ten times the official number, but that was before testing had increased.
So, the real number right now might be lower, but let’s say it’s a third of the population. That still leaves two-thirds vulnerable. We know from past pandemics that not everyone will get infected (I believe it was 20 to 30 percent who ultimately got the 1918 Spanish Flu, but that virus was more lethal, which caused it to spread less efficiently). This virus might sit in a dangerous middle ground where it’s bad enough that it causes many deaths and complications, but mild enough for some people that they either don’t know they have it or have minimal symptoms and just keep living as normal and spreading it.
The fact that cases, hospitalizations, and deaths are still rising says to me that we’re not closing in yet on whatever that percentage of the population is that’s going to have to get this before it starts to decline. If it’s taken us nine or ten months to get to a third of the people having had this, and if the percentage needed for transmission to slow is 50 percent, it looks to me like we just better hope the vaccines get distributed quickly, because we’re still several months away from any kind of herd immunity slowdown. Of course it might be 40 percent, but then it might be 60. It seems unknowable, so it doesn’t seem like we can put any hope in it.
You’re more of a numbers guy than I am, so tell me what I’m missing here.
one important point that is missing on the 1918 spanish flu is that it killed moderately heavy across all ages including otherwise healthy individuals except those over age 50.
The primary reason that those over age 50 has much higher survival rates from the 1918 spanish flu was that there was a prior influenza pandemic 1873-1875. Therefore , they developed immunity which the younger generations did not develop.
The point is that hiding from the virus is the worst possible approach. The population needs to develop immunity, whether it comes from natural exposure or from a vaccine. Either way, Immunity is the only way out.
True, we have to get immunity some way, but the whole point to begin with back in March was if we just did nothing, hospitals would fill up and the sick (with Covid or anything else) wouldn’t be able to get decent care. We can see right now that the hospitals are, in fact, filling up again.
Lockdowns are a bad public health measure – even the WHO says so – but not all public health measures are bad. I believe it’s essential to slow the spread of this virus unless we just want to let people die while we shrug our shoulders and say it sucks to be them.
99% survival rate. Death count includes people who die with covid. Lockdowns and masks don’t work. You have no right to impose your will upon others, even for “safety”. Government should not exist. You cannot prevent the spread of this virus. that is all.
The present CFR is between 0.4 and 1.0% i most countries. Howvere averaged over the course of the pandemic the rate is typically between 2% and 5%. And far more variable country to country
The likelihood of a 70 year old person dying because of of covid is still low. Covid did not affect overall deaths of old people. 94% of covid deaths include co morbidities. Pneumonia,heart disease, and influenza deaths have gone down significantly since last year. It is safe to assume that the death count includes people that would have died from something else anyways.
For a detailed analysis of the impact of co-morbidities see:
https://medrxiv.org/cgi/content/short/2020.09.30.20204990v1
The co-morbidity with the largest correlation is kidney disease. For people with extreme sensitivity to the virus the kidneys can suffer catastrophic function damage in a couple of weeks.
Thanks so much for that link; it’s fascinating. I was surprised at its finding that nearly all of the heavily-advertised comorbidities such as obesity, hypertension, and heart disease had little if any correlation to mortality and in some cases even had a negative correlation, in that people with the condition actually did better. Age itself seems to show the strongest correlation to mortality risk. If this study is correct, we may have seen a case of “round up the usual suspects” when fingers were pointed at comorbidities.
KenInd,
As I recalled the cutoff time for those data was mid-September. Data carried out to November do now show the significant co-morbidity with a minority of patients which chronic kidney disease. That statistical observation is corroborated by actual medical observation in hospitals in which a small minority of patients extremely sensitive to the SARS-CoV-2 virus suffer catastrophic damage to kidney function in as short a time as 2 to 3 weeks.
“There is nothing from the CDC that I can trust.”
— Dr. Deborah Birx
I trust the cdc more than these “experts” that got EVERYTHING wrong.
I keep getting told how hospitals are getting overwhelmed, but none of it is true. even if it were true, how does that justify a lockdown? Isn’t that their job?
Ah, here we have one of the people barging into hospitals demanding to see the full ICU beds because of course they are lying to make Trump look bad.
One of the things I found interesting was the pattern of reported coronavirus-linked deaths around Thanksgiving. I was expecting that the reported new cases of the virus would be suppressed on Thanksgiving and perhaps for a couple days after. The holiday might affect when people decided to get tested or otherwise seek medical care. And there might be a slightly longer delay in getting some test results.
But there was also a pronounced suppression in the number of reported coronavirus-linked deaths for Thanksgiving and several days after. Was there a delay in the reporting of some deaths during that time? Or, does that drop in the reported number suggest that for a large portion – maybe half – of coronavirus-linked death the timing of those deaths is largely determined by decisions made by family or perhaps health care providers? Does the timing of many coronavirus-linked death depend on when family members decided to stop life-sustaining assistance? And many waited until after the holiday (and even after the holiday weekend) to cease such assistance?
There had been a pretty consistent pattern where the number of reported deaths were down on Sundays and Mondays. Was that largely caused by greater delays in reporting on the weekends or by family members (or health care providers) deciding not to cease life-sustaining assistance on weekends?
My assumption has always been that this weekend depression is due to a reporting delay. The other factors you cite might contribute to this also, but because the lull occurs not only in deaths but also in reported cases, I think that seems to support the idea that it’s reporting.
You’re correct. The ~7-day periodicity in the CFR is almost certainly due to reporting delays over the weekends. That periodicity has been present for at least the past 150 days.
That’s what I’ve long assumed as well. It wasn’t until I saw the lowered numbers extend for 4 days beginning with Thanksgiving that I started to wonder about the other possibility. I was thinking the lowered numbers wouldn’t last that long if it was mostly reporting related, so maybe they both (i.e. new cases and new deaths) were lowered for similar reasons not related to reporting – i.e., because people were making decisions about timing, e.g., when they were tested or when they ended life support.
That said, as I’m thinking about it now you’re probably right, The issue with longer delays in reporting probably began the day before Thanksgiving and extended into the weekend and that’s the reason for most of the lowering of the numbers. I say it began the day before Thanksgiving because the numbers were substantially lower on Thanksgiving, and they’ve routinely been substantially lower on Sundays and Mondays rather than Saturdays and Sundays. So I assume there’s normally something like a one day delay for a lot of the reporting and that delay gets longer on the weekends.
Lathering the rubes
Lathering the rubes
The professor gets his jollies
Lathering the rubes
Wow! You had to comment with a meaningless post from clingerville
I commented early, only to watch a parade of amateur epidemiologists insist that there’s nothing to see here for reasons ranging from increased testing to outright fraud. I would have hoped that Richard Epstein’s experience would have been an object lesson to everyone who can run a regression analysis or manipulate a spreadsheet. To refresh the collective memory, Epstein assumed that his expertise as a lawprof combined with his love of economics, his brief study of virology, and his facility with statistical software qualified him to predict that the Covid epidemic in the United States would conclude with a national death toll of 500, a figure he later revised to 5,000. Treating 500 as one Epstein unit, we are fast approaching 600 Epstein units with no end in sight.
What Professor Epstein and the majority of commenters here seem to have overlooked is that the key to quantitative analysis is not computation, but model definition. Anybody with a pc and Excel can run regression analyses forever without making a computational error; good software eliminates that risk save for data entry errors. But no software yet in existence can create a model for predicting the course of the Covid pandemic; there are a vast array of variables, some confounding, some independent, some contingent, and the design of the model and the selection of data, not the computation that follows, is what differentiates experts from wannabes.
Epidemiology, like virology and public health, is an academic and professional discipline. Most of us are not stupid enough to think that, with some Google research we can perform brain surgery or design spacecraft or otherwise masquerade as experts in a discipline in which we have neither the education nor the experience to qualify. Why we so confidently assume we know more than do public health experts who are epidemiologists or virologists, and who have both the academic training and experience to practice those disciplines, is a mystery explainable only by the naked partisanship that underlies this comment thread. Being a libertarian, a socialist, a liberal, or a conservative does not, in and of itself, make anyone a public health expert. Neither does being a lawprof, an economist, or a physicist. This is not Trump v. Biden, or left v. right; this is life v. death with a virus that does not recognize politics.
Infections are rising rapidly. So are hospitalizations, and though a few weeks behind, so are deaths. If you think those numbers are fake news, go visit a Covid ward, don’t wear any PPE, and while you’re there, breathe deeply, secure in the belief that you are the real expert.
VC coronavirus threads are more an exercise in psychology than reality.
John Ioannidis, an epidemiologist, also initially predicted that the Covid toll would be very low, but he revised that as more data came in. Britain’s Neil Ferguson, said this was going to be terrible; sadly, he was correct (but his numbers, too, have changed from his initial extreme pessimism).
People can question what experts say because they don’t all agree, but all you have to do to see that this pandemic is bad and getting worse is look at the numbers. Covid deaths, excess deaths, hospitalizations, cases. Unfortunately, a common belief now is that reality is what a person wants it to be, and that any statistic that contradicts said belief is a fabrication. I don’t do regression analyses; I couldn’t even tell you in 10 words or less what one is. But I can open my eyes and see what’s happening.
Absolutely great comment! Like to see you comment more in the future.