The Volokh Conspiracy
Mostly law professors | Sometimes contrarian | Often libertarian | Always independent
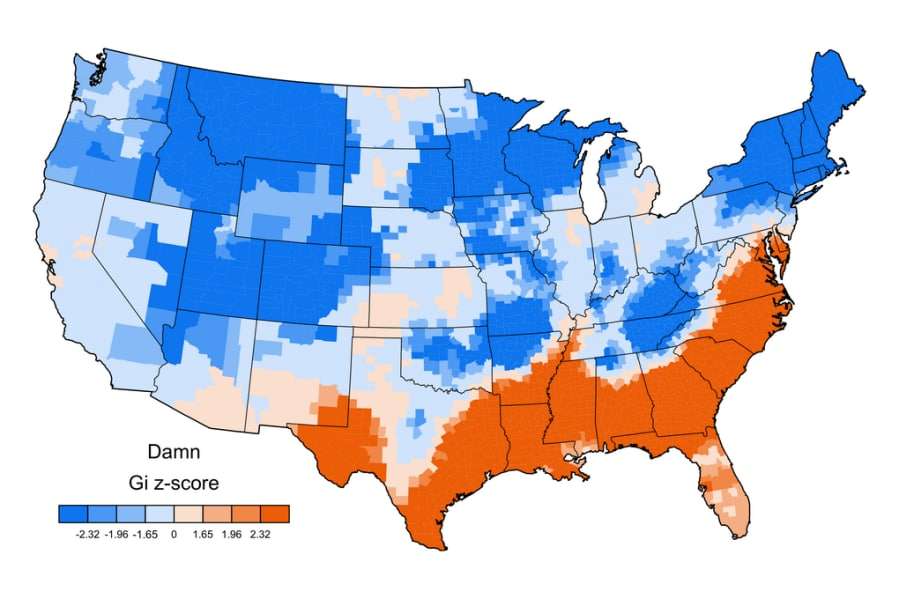
Mapping swearing throughout the U.S.
Stan Carey (Strong Language) has a fascinating post about this, based on work by Jack Grieve that analyzes millions of geo-coded Twitter messages. (Of course, there are natural limitations to the Twitter data set, since Twitter users aren't entirely representative of the public at large, but until everyone starts constantly recording everything everyone says and then uploading it online, it's the best we can do.) Here are a couple of samples, with red meaning higher frequency and blue meaning lower:
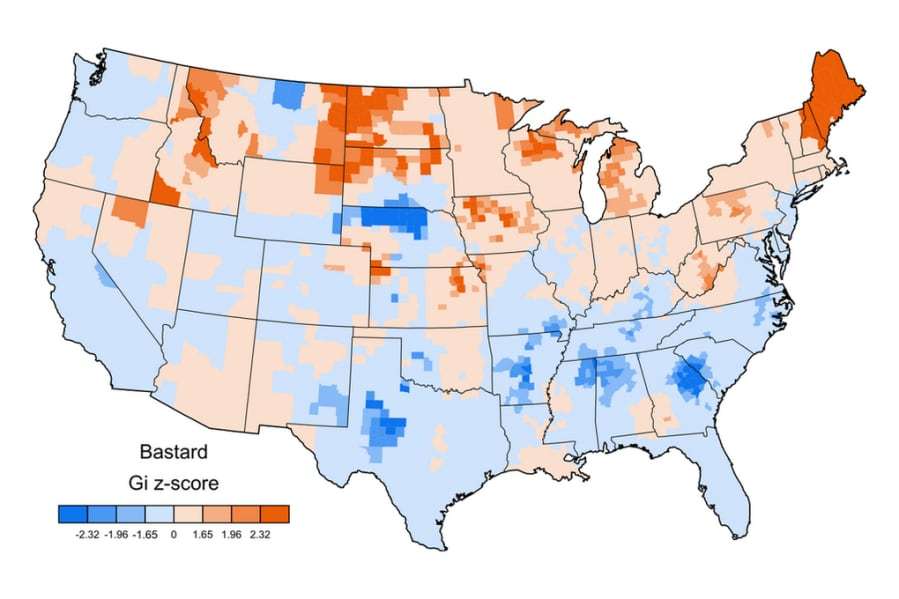
And there are many more maps for many more, er, colorful terms.


