These Climate Change Charts Are Scary. They're Also Wrong.
The job of scientists isn't to manufacture alarm. It's to communicate the truth.
HD DownloadBloomberg columnist Mark Gongloff says this scary-looking chart is something "climate denialists can't ignore" because it shows how much hotter the world has been getting since 1930.
The chart should actually look like this.
How about this terrifying graph showing record warm temperatures?
It should look like this.
These are two examples of how climate scientists manipulate data to generate scary-looking charts. Global warming is real, but using statistical tricks to frighten people into panicking about it poisons the public discourse and leads to bad policy decisions.
Both charts are known as hockey-stick graphs because they show a sharp, alarming upward trend in temperature.
Here's the original hockey stick graph from 1998.
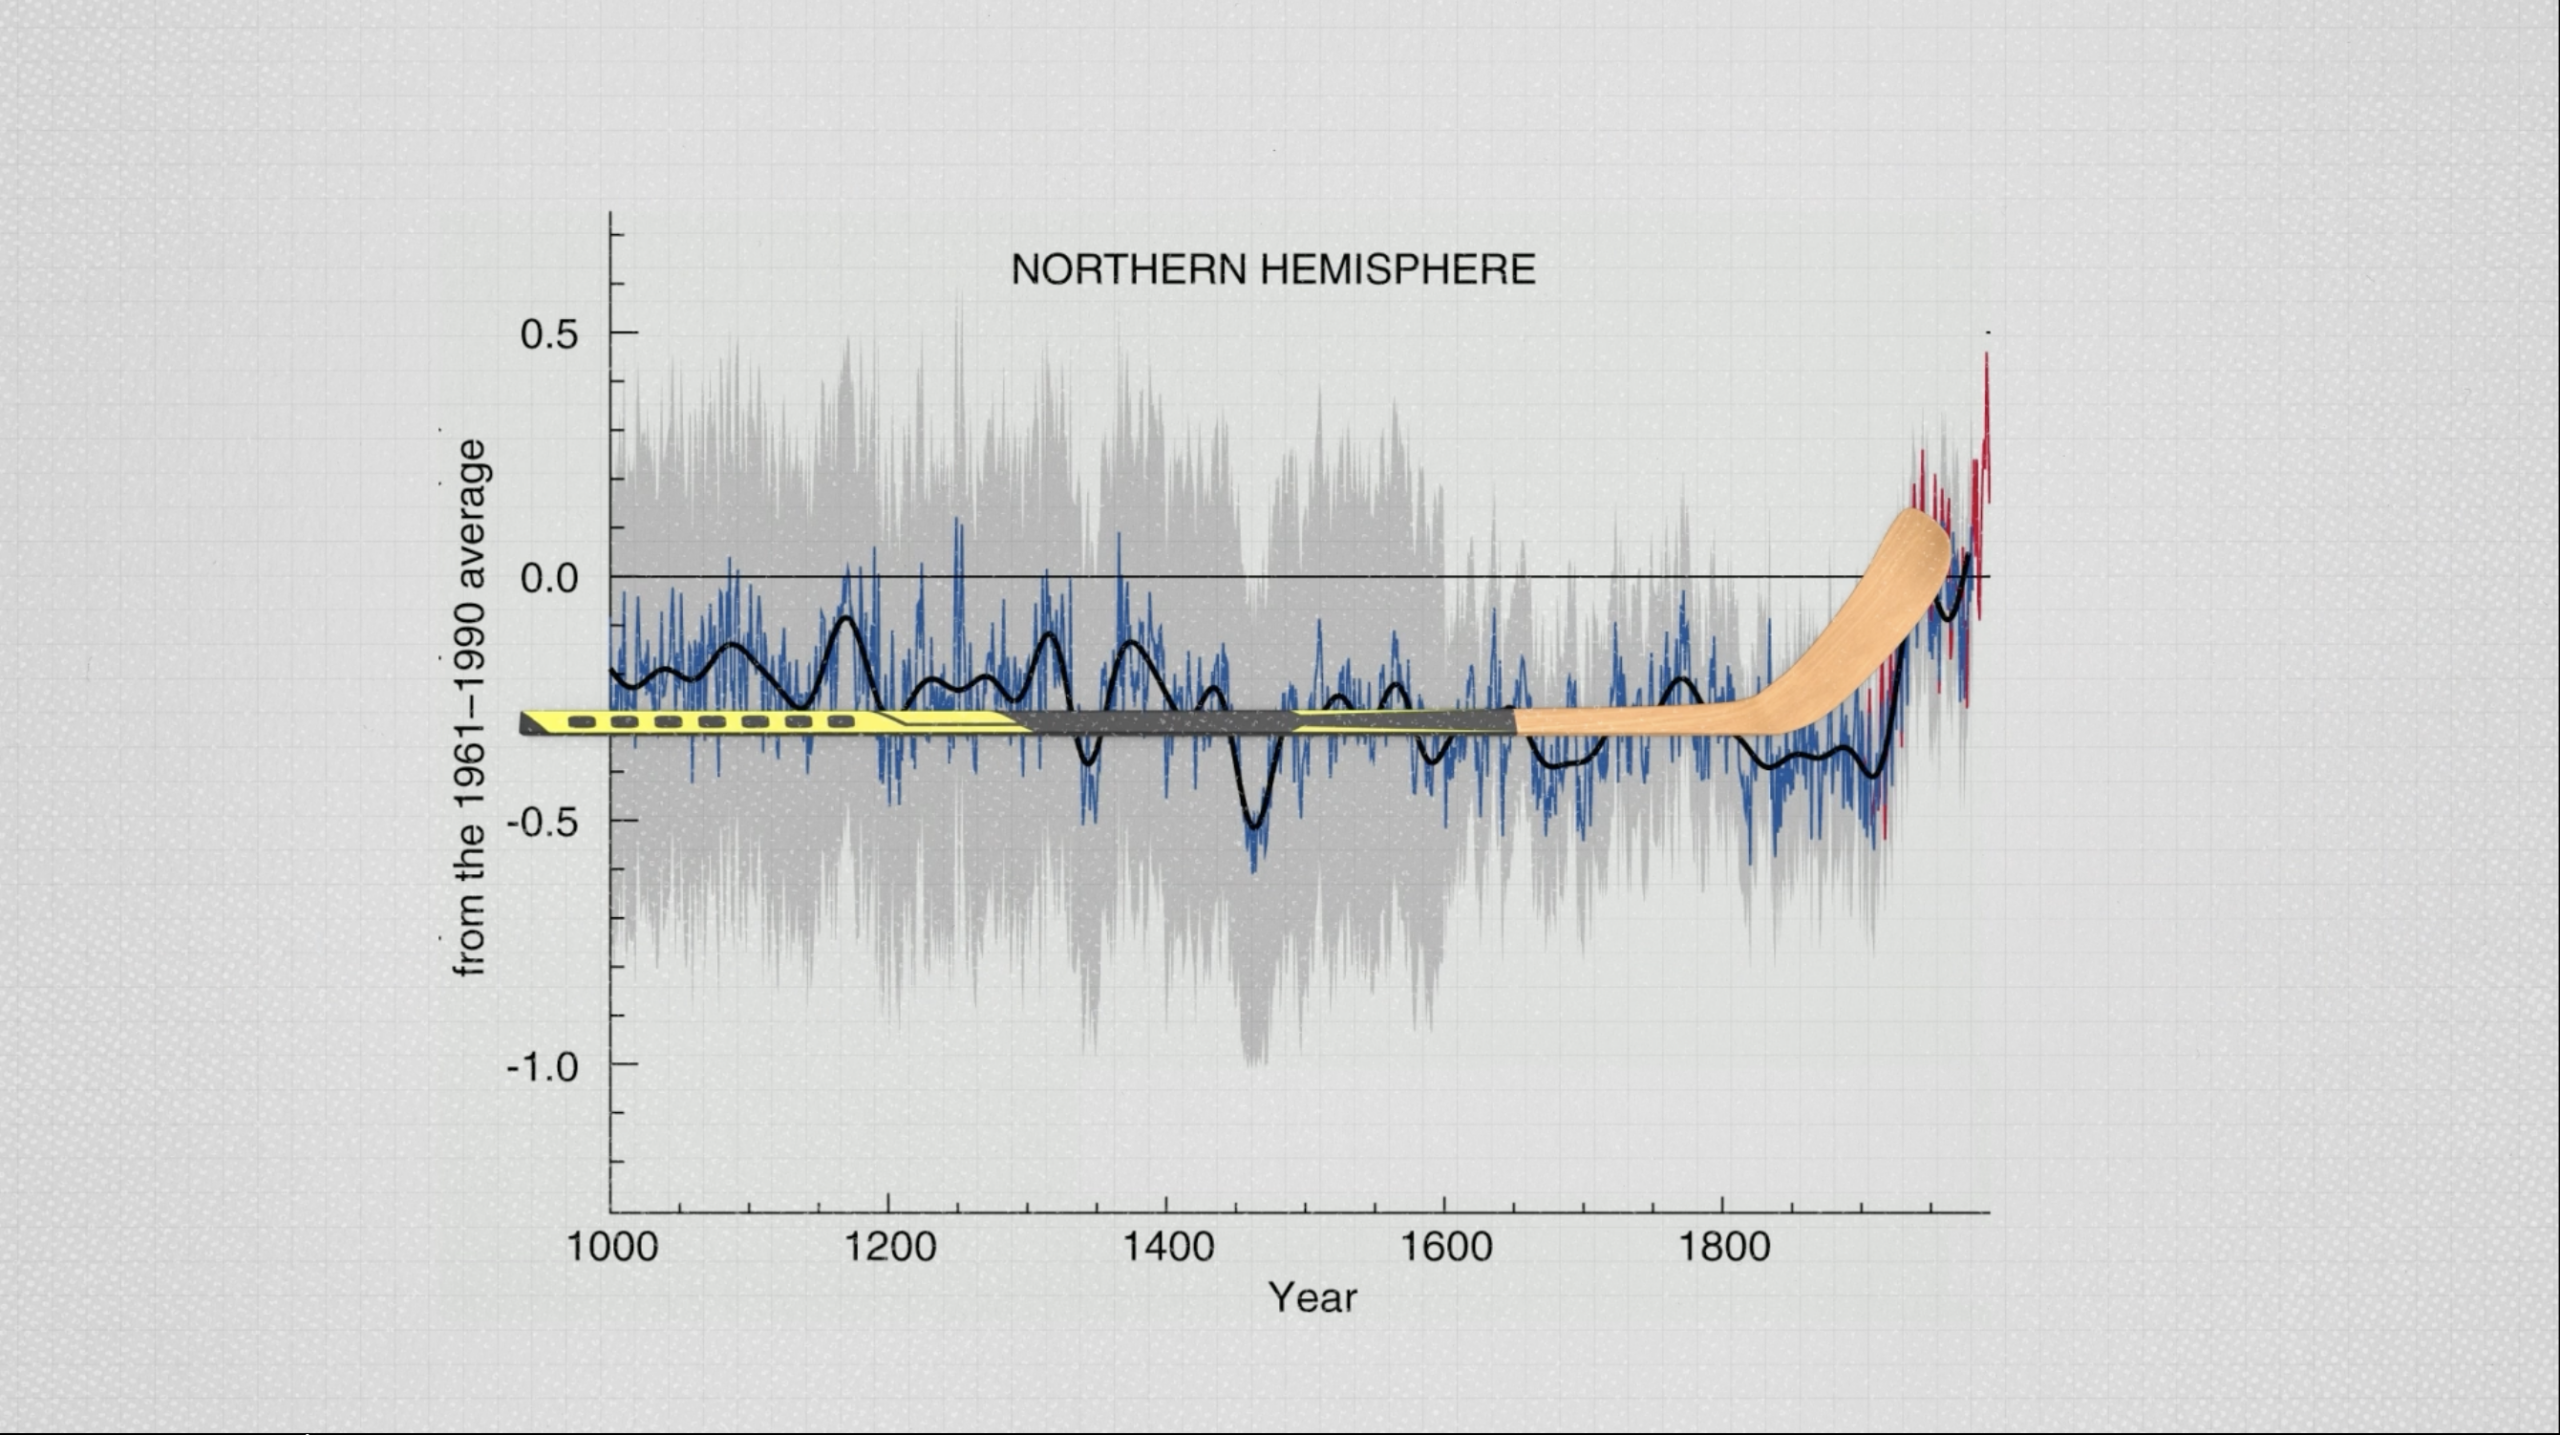
It was created by climate activist Michael Mann, who exploited widespread ignorance of physics and mathematics to advance his point. He refused to reveal his data and methodology. He grafted the scary red line on the right, unrelated to the data in the rest of the chart. He used a biased statistical method to stitch together unreliable proxy data, and the graph dramatically overstated the certainty of past temperatures.
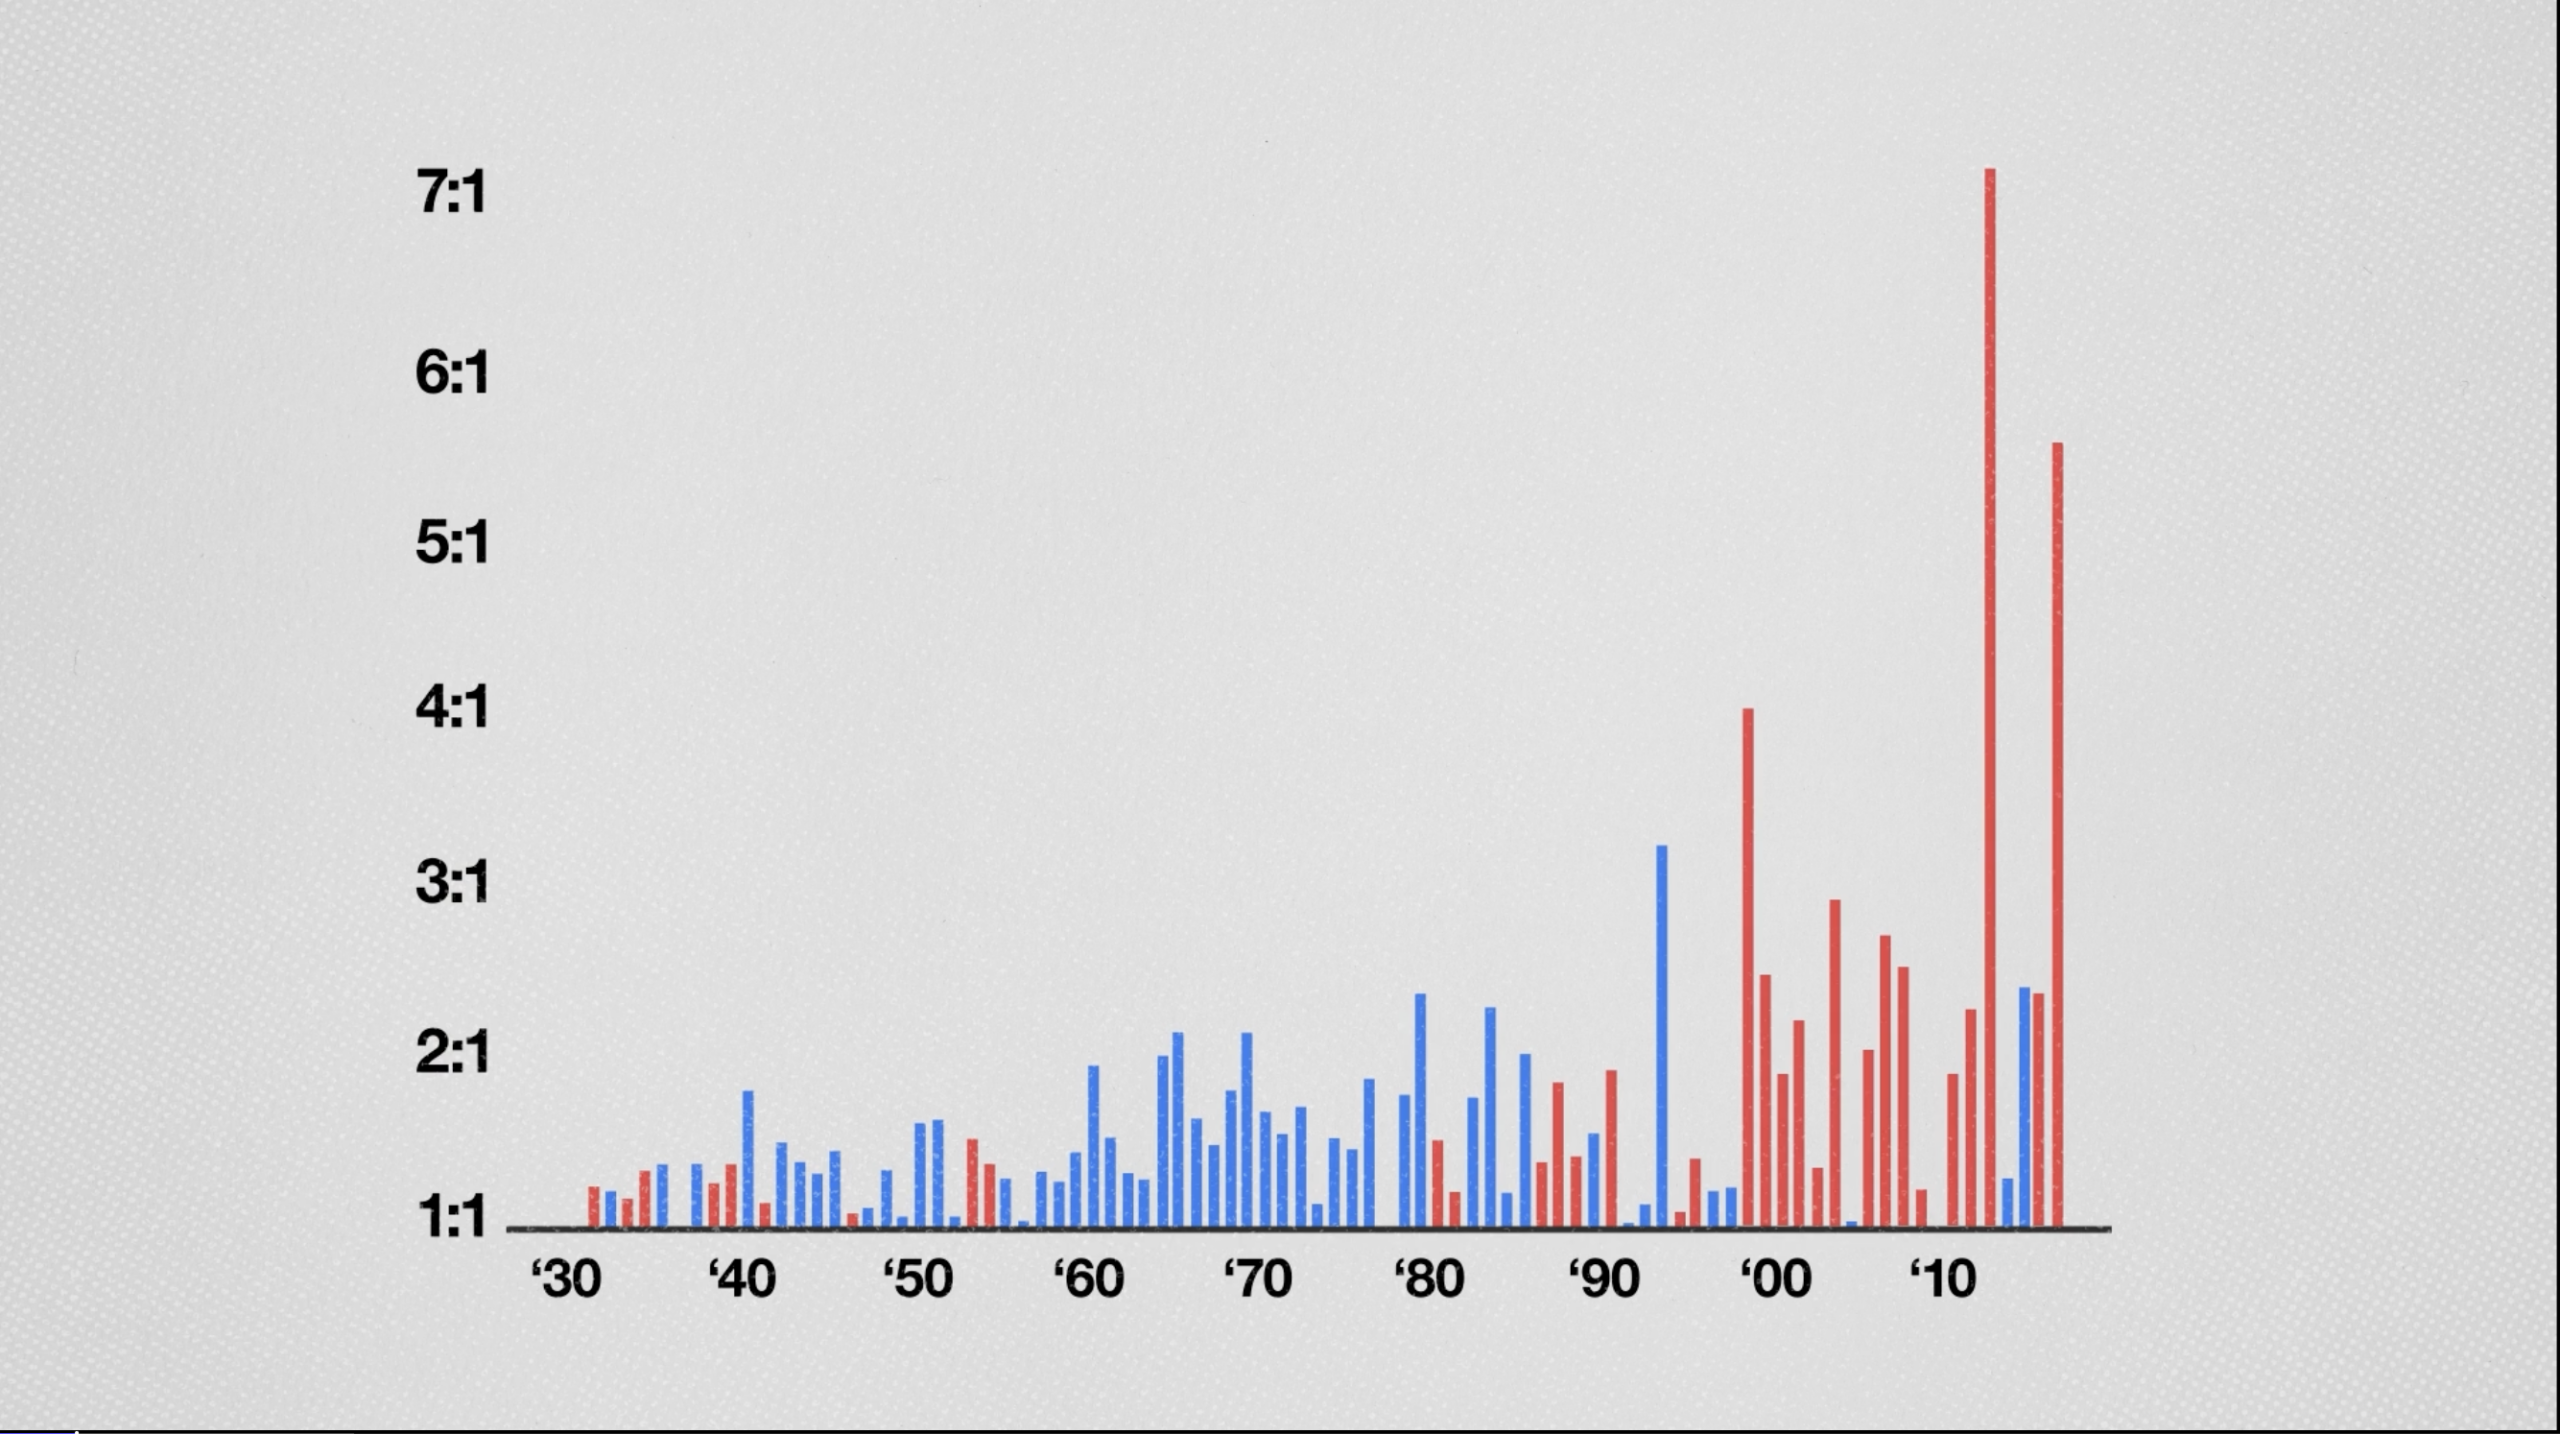
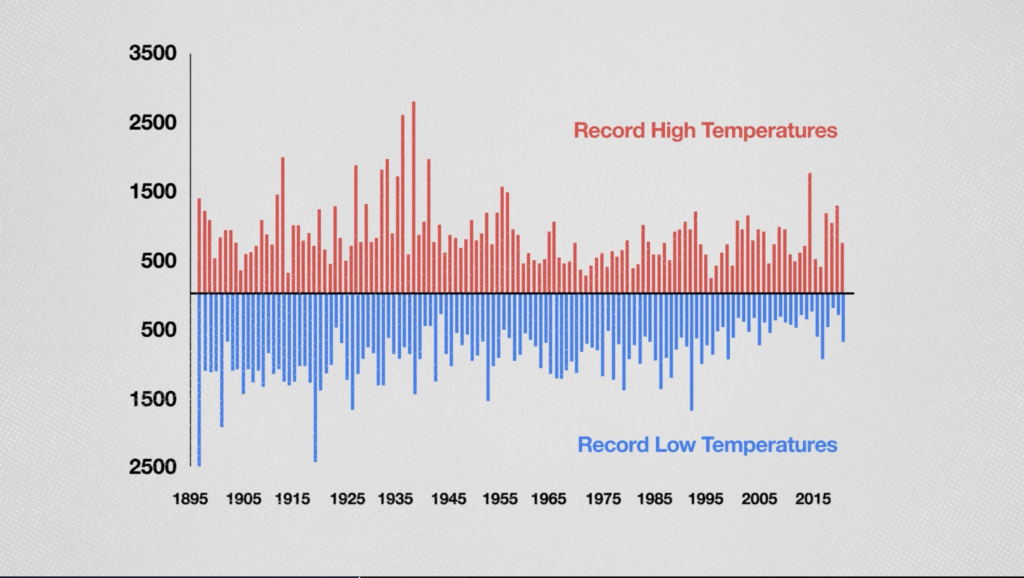
Here's the more recent hockey-stick chart I showed above, which was published by the U.S. government's Global Climate Change Research Program.

It measures record-high temperatures in the U.S. using ratios. The red lines show the ratio of record-high to record-low daily temperatures, and the blue lines show the ratio of record-low to record-high daily temperatures. If there were more record highs than record lows, you see a red line; if there were more record lows than record highs, you see a blue line. And the line's height is the ratio.
The only reason to present the data as a ratio is to create a scary visual in which the alarming-looking red lines get taller and taller. The chart is labeled "Record Warm Daily Temperatures Are Occurring More Often," but as the theoretical physicist Steven Koonin explained in his 2021 book Unsettled: What Climate Science Tells Us, What It Doesn't, and Why It Matters, that's not what it shows.
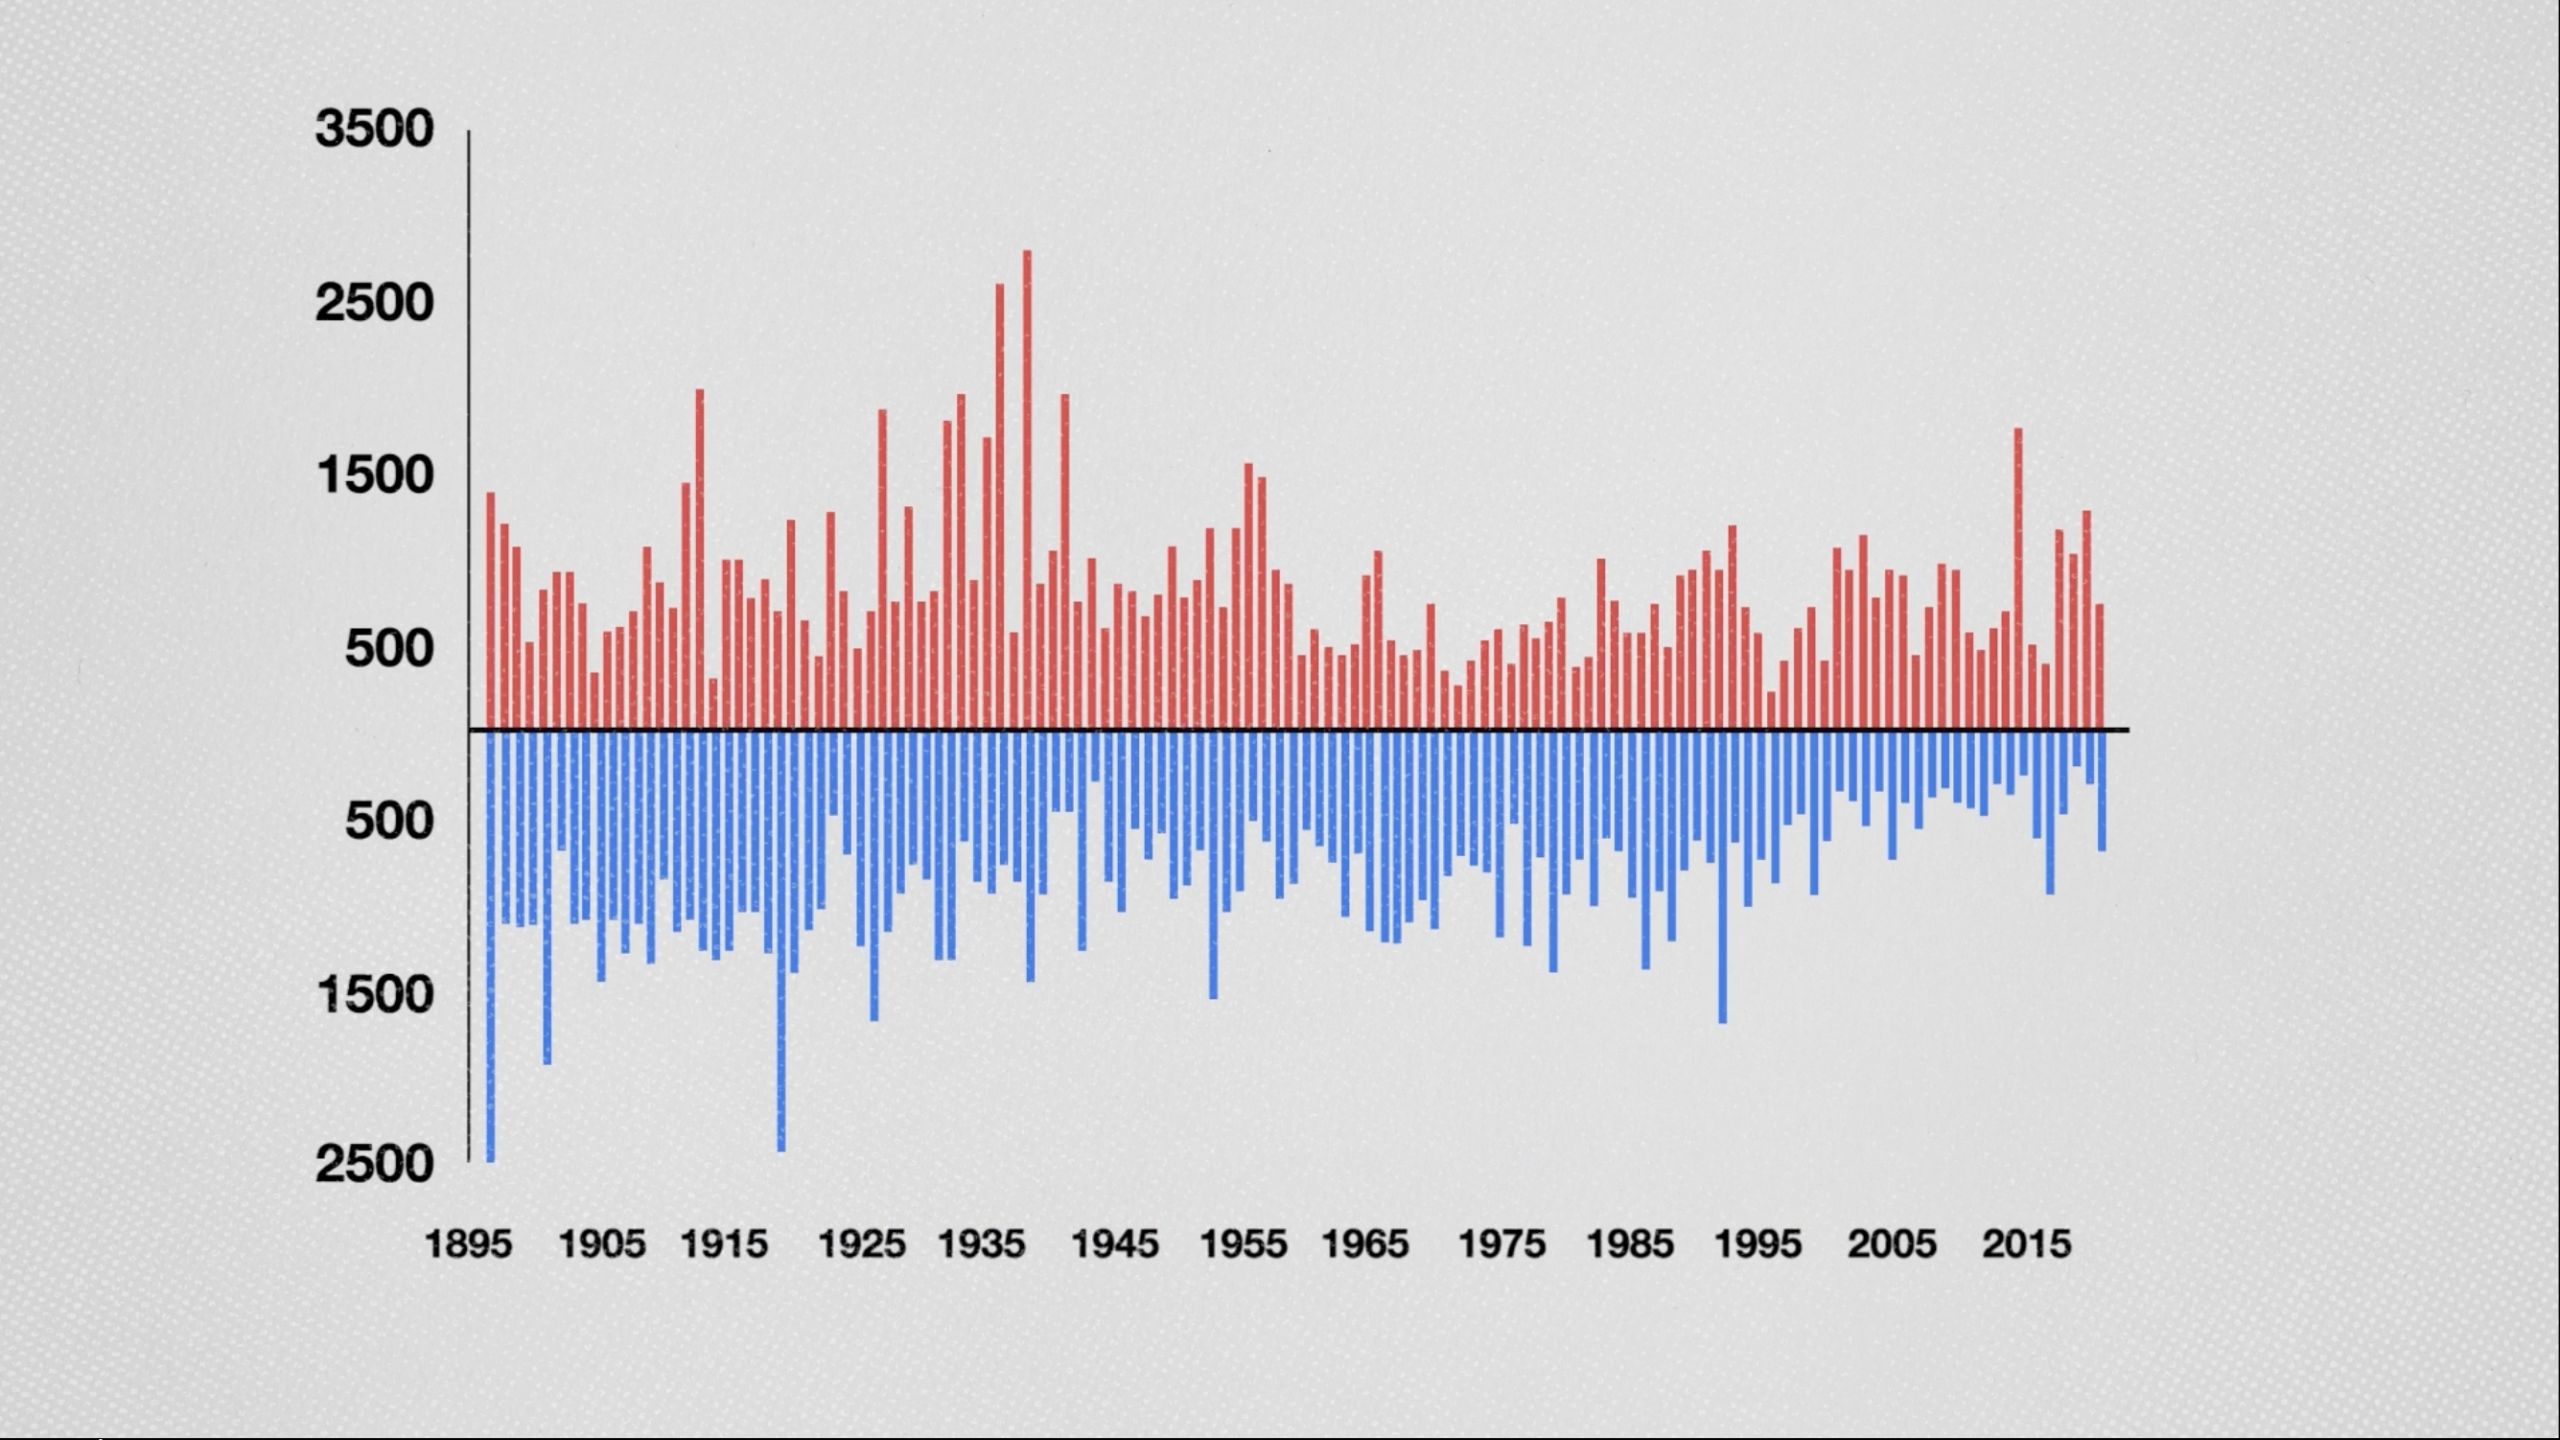
Koonin graphed the number of record warm days in the U.S. and, as you can see, they're not occurring more than in recent years.
Only when you put the figures in terms of a ratio does it make it look as if record-high temperatures are increasing. What's actually going on is that the number of record-high temperatures is holding steady, while the number of record cold days is decreasing. And that's what's making the ratio lines go up.
Koonin identified another problem with the chart. A "record" warm day is defined as a record up to that point in time, starting in 1895. In the early years, there were many warmest and coldest days because it's easy to set records over short time spans. By 2018, a day had to be the warmest or coldest in 124 years to count, so record days occurred less frequently. Low denominators will yield higher ratios, thereby exaggerating any pattern.
The decline in record cold days in the U.S. is a worrisome trend and evidence of a warming Earth. But it's not a terrifying-looking chart. Unlike the government's version, which uses ratios, Koonin's version is designed to educate people about climate rather than to incite panic.
When this chart appeared in his book, Koonin's critics accused him of claiming that the Earth was warmer in the 1930s than it is today. But he never made that claim. The graph shows record-high temperatures, not average temperatures, and is limited to the U.S. It was created to refute the "hockey stick" chart based on the same data.
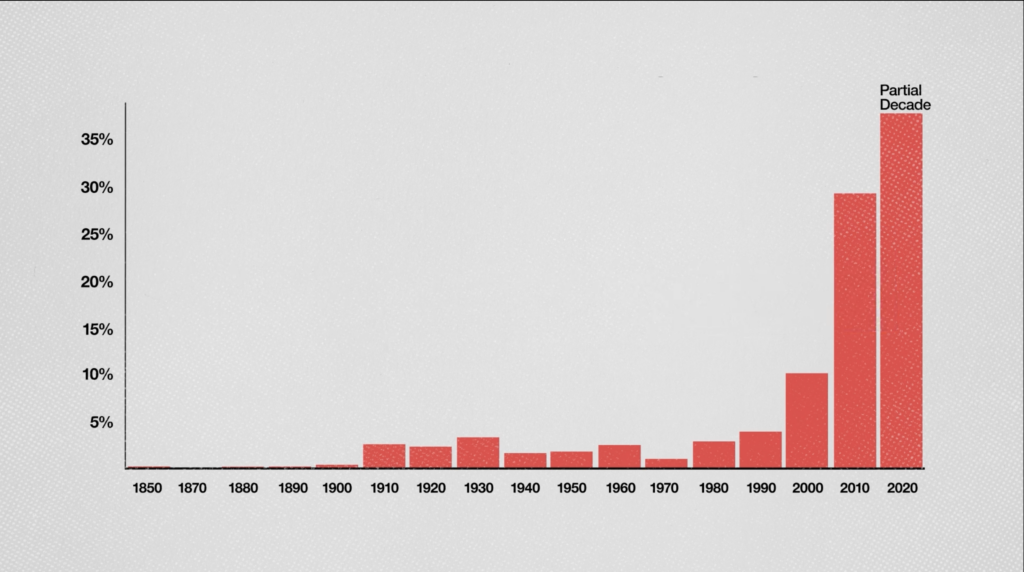
The climate scientist Zeke Hausfather, who has accused Koonin of cherry picking his data, has produced yet another hockey stick chart, this one showing the percentage of the world that reached record-high temperatures each decade from the 1850s onward. This chart claims to show that the percentage of places with record-high temperatures grew steadily over time, and then exploded in recent decades.
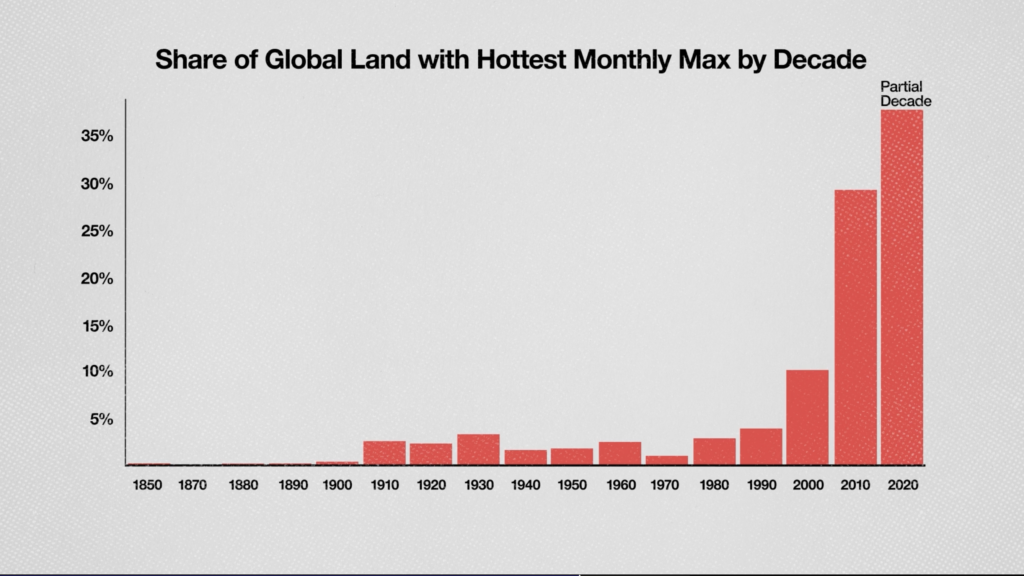
Gongloff claimed that Hausfather's chart refutes the "denier bromide" that "the world was hotter in the 1930s."
It refutes nothing. It's just another meaningless chart.
The first problem is that we don't have good temperature data going back to the 19th century. The rise you see partly represents the improving quantity and quality of temperature measurements—with more data points, you're bound to detect more record highs.
The same organization that provided Hausfather's dataset publishes another dataset that is more limited than Hausfather's dataset, ending in September 2021, but that accounts for measurement uncertainty. I used it to generate this chart and made two changes to Hausfather's presentation of the data.
First, I estimated the fraction of land area of the Earth that experienced its highest temperatures by the number of data points available for that year, rather than the total number of data points in the most recent records. For example, if in an early year we have data for only 1,000 regions of the Earth, each one with a record temperature for that region counted as 0.1 percent of the Earth. If in a later period there were 10,000 regions, each region with a record counts as 0.01 percent of the Earth.
Second, instead of selecting the one month in each region with the highest temperature, I prorated credit for the hottest month based on the likelihood that it was the hottest. For some regions, there was an unambiguous hottest month—one in which the lowest point of the uncertainty range was higher than the highest point of any other month's uncertainty range. But for most regions, there were multiple months with uncertainty ranges that could have made them the hottest. I gave each of those months credit for the amount its uncertainty range overlapped the overall uncertainty range for the hottest months.
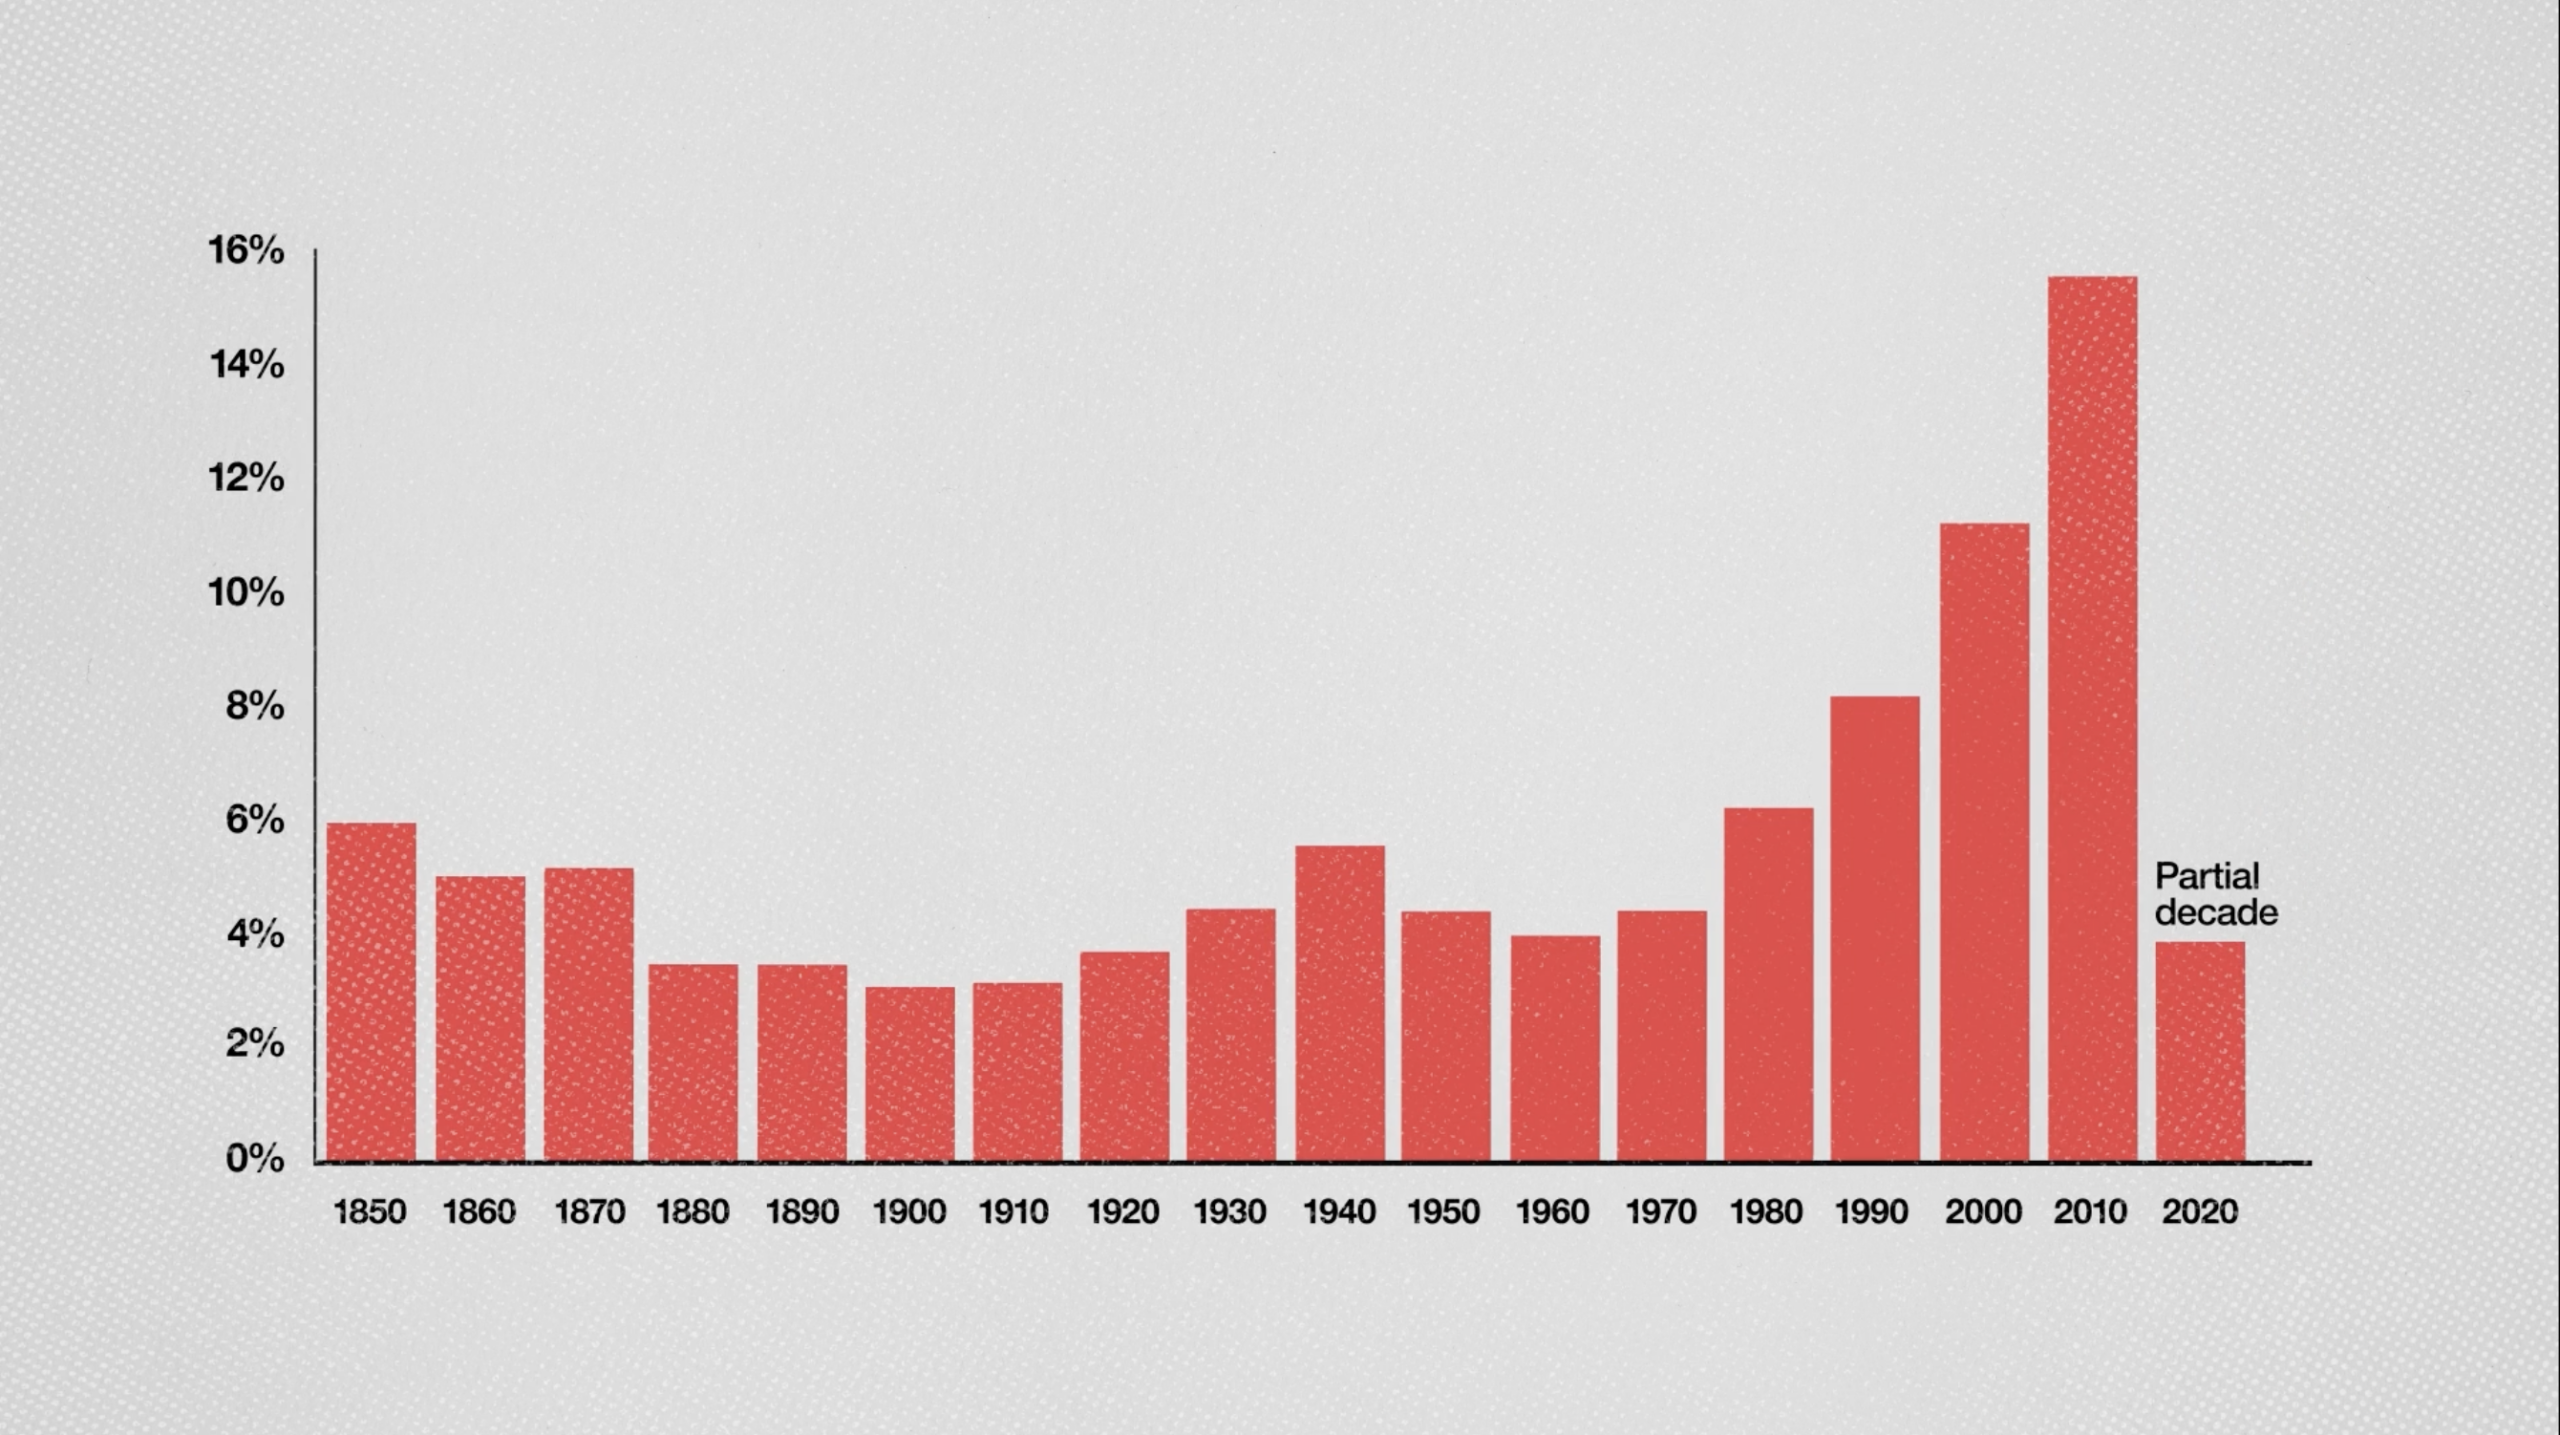
This produced the following version of Hausfather's chart.
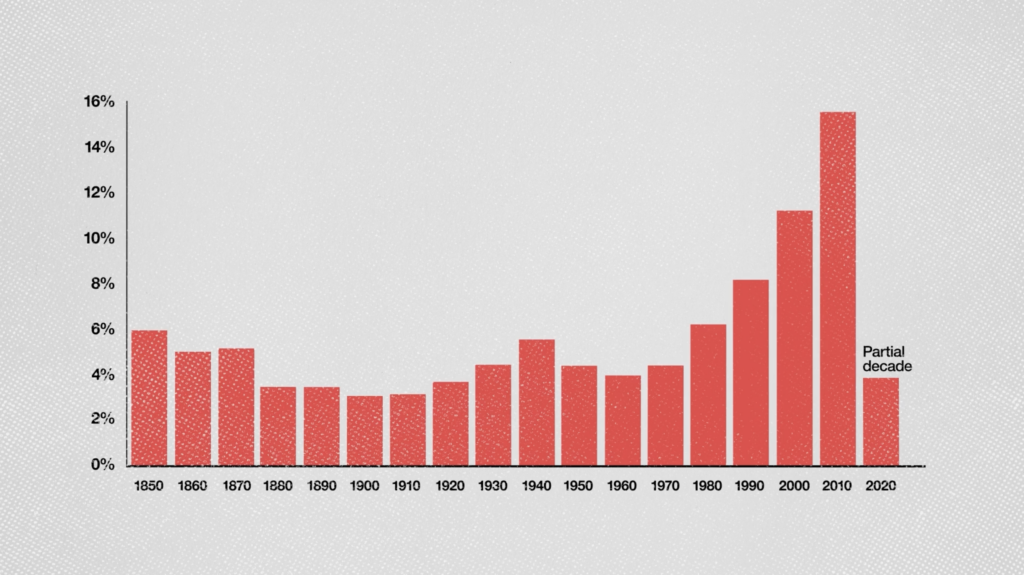
Note that the bar on the far right representing the 2020s includes only the 19 months in my dataset. If we prorate to the entire decade up to December 2029, assuming the same rate of new heat records, it would be the highest bar on the graph at over 20 percent. Hausfather's chart also showed only partial data for the 2020s.
It's not a terrifying hockey stick showing an explosion of heat, but it does suggest a statistically significant trend. It's much more plausible than Hausfather's version. It shows similar levels of records from 1850 to 1970—a period in which global mean temperatures had no strong trend. It's hard to believe there were virtually no heat records anywhere in the world before 1910, as Hausfather's chart suggests.
My version also shows gradually accelerating warming beginning around 1960—in line with global mean temperatures—rather than a sudden explosion in the 21st century accelerating out of control. The 3.8 percent for the 2020 decade represents only 20 months. If we multiplied it by six to make it comparable to the other 120-month periods, it would be 22.8 percent, continuing the accelerating increase.
But I wouldn't recommend either of these charts as a measure of climate change. They reflect weather, not climate. Weather is a measurement of local, short-term conditions; climate is a measure of long-term global averages, and is thus more meaningful.
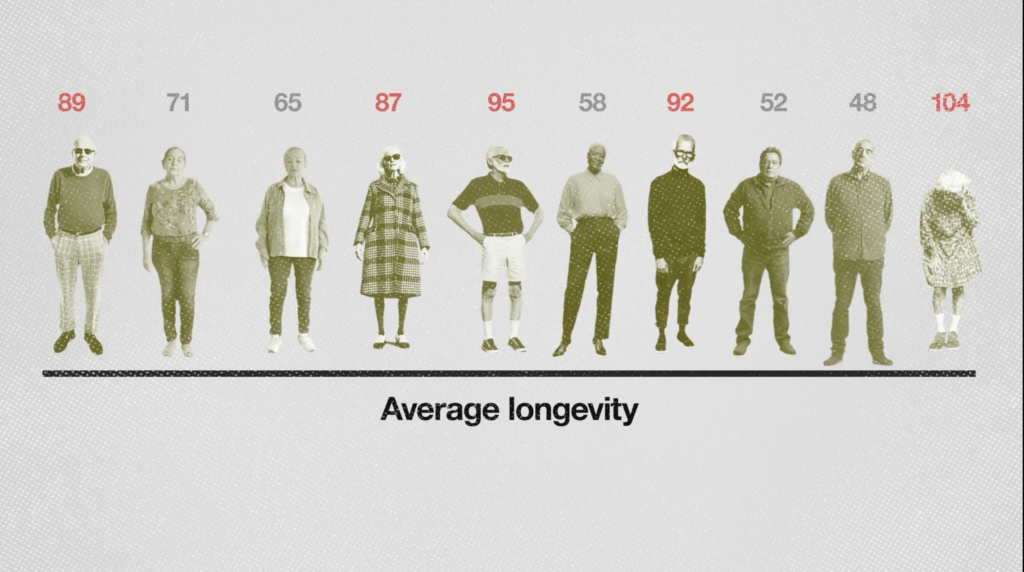
Graphing record-high temperatures is equivalent to measuring changes in life expectancy by comparing the record-breaking ages at death of people in different places. You're looking at idiosyncratic outliers rather than focusing on what matters, which is average longevity.
There are responsible ways to visualize climate data. We can use the same dataset used to illustrate global heat maximums to graph global heat minimums. This shows the most dramatic effect of global warming: the near disappearance of record-cold months. Humans living in most places may not miss these cold snaps, but they are an unambiguous warning of potential future problems.
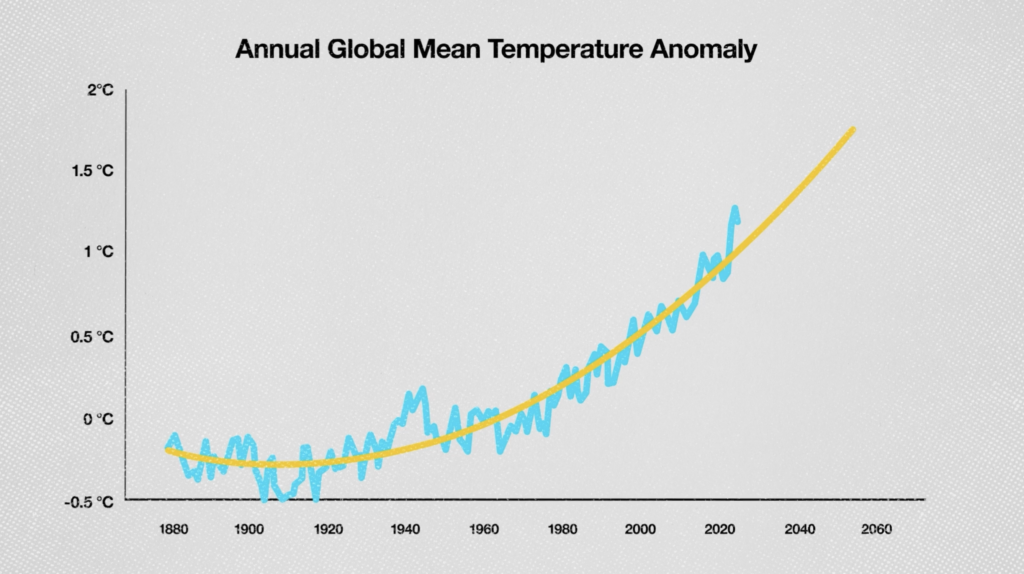
Alternatively, consider this estimate of the annual global mean temperature anomaly since 1880 (blue), with a simple fit to the data (yellow). It's not a hockey stick showing a sudden change, but it does show accelerating warming that will bring us near two degrees centigrade by 2060 if the trend continues.
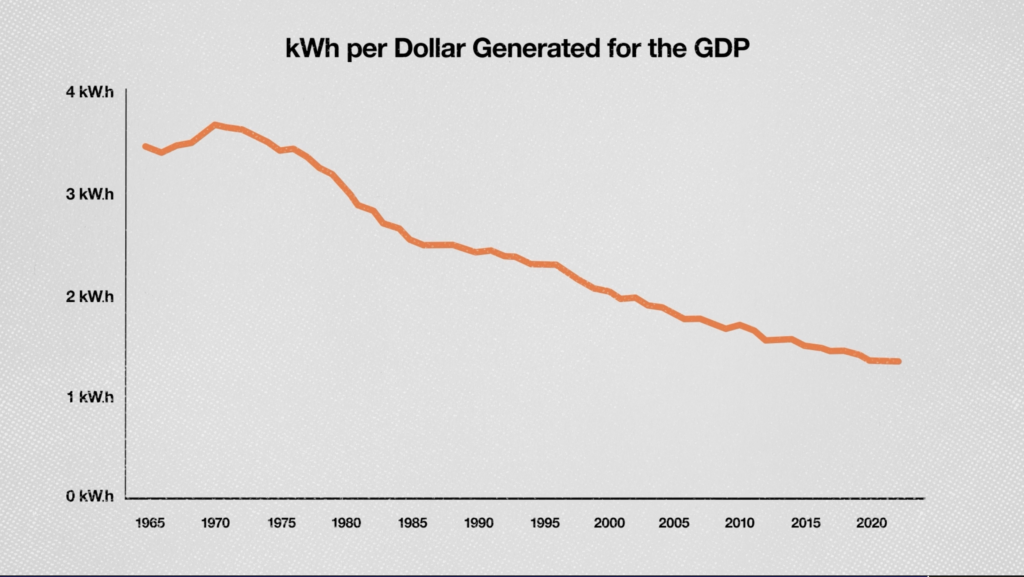
There's plenty of good news, too. This chart shows the number of kilowatt-hours of energy required to generate a dollar of real gross domestic product in the U.S. It indicates that, relative to 1965, it takes 60 percent less energy to produce the same amount of real wealth, and the ratio is falling steadily. It shows that we can continue to enrich the world with ever-lower environmental impact, and that we can confront climate change while maintaining economic growth.
Sensible progress requires honestly evaluating climate change and devising realistic strategies to address it, not manipulating data to generate hockey sticks. The job of scientists isn't to manufacture alarm. It's to communicate the truth.


