What Climate Science Tells Us About Temperature Trends
Is it time to panic?

This article expands on claims about global temperature trends made in Ronald Bailey's article in the January 2020 issue of Reason, "Climate Change: How Lucky Do You Feel?" for readers who are keen to dive deeper into the topic. (The print article is currently only available to subscribers.)
I began my time on the climate change beat as a skeptic. After attending the 1992 Earth Summit in Rio de Janeiro where the United Nations Framework Convention on Climate Change was negotiated, I noted in a Reason article that by signing the treaty "United States is officially buying into the notion that 'global warming' is a serious environmental problem" even while "more and more scientific evidence accumulates showing that the threat of global warming is overblown." I was simply unconvinced that the available data demonstrated the need for the kind of radical intervention activists were proposing.
But I stayed on the beat, closely following the progress of scientific study and policy debate. By 2005, following significant corrections to the satellite data record, I declared in Reason that "We're All Global Warmers Now." And in 2006 I concluded that "I now believe that balance of evidence shows that global warming could well be a significant problem."
In the years since 2007, I have remained largely sanguine, joining the many who noted that global temperature at the beginning of this century rose at a considerably lower rate than that projected by computer climate models. I was generally persuaded by researchers who predicted a sedate pace of increase, with temperatures unlikely to rise much above 1.5 degrees Celsius over the 19th century average. In this scenario, the world might get a bit warmer, but people and societies have proven themselves up to the task of adapting to such changes in the past and fundamentally the process of lifting hundreds of millions of poor people out of abject poverty through technological progress and economic growth fueled by coal, gas, and oil can safely continue unabated.
But as research continued, a number of possible scenarios have emerged. For example, some people read the scientific evidence as suggesting that man-made climate change is not greatly impacting people now, but might become a bigger problem toward the end of this century. Basically current weather—droughts, rainstorms, snowfall, and hurricanes––cannot now be distinguished from natural variations in climate. However, as the temperature increases computer climate models project that future droughts will last longer, rainstorms fiercer, snowfall less, and hurricanes stronger. In addition, coastal flooding of major cities will become more common as sea level rises. These changes in climate will put the property and lives of children and grandchildren at greater risk. Computer models combining climate and economic components calculate that endeavoring now to slow warming would cost about the same as later efforts to adapt to a somewhat hotter world. Let's call this the somewhat worried scenario.
Another set of people note that temperature increases have apparently resumed a steady march upwards after a slow-down at the beginning of this century. They parse the results of recent studies that conclude that climate change is already causing deleterious impacts, e.g., heat waves both on land and in the oceans are becoming more common, the extent of Arctic sea ice is steeply declining, and glaciers, ice sheets, and permafrost are melting. The sanguine conclusion that future warming will proceed slowly and not rise much above 1.5 degrees Celsius by the end of this century appears to be too optimistic. If greenhouse gas emissions continue unabated, average global temperature looks to be on track to reach 1.8 degrees Celsius in 50 years and continue rising beyond 2 degrees Celsius by 2100. This trajectory significantly increases the risk that things could go badly wrong. This is the really worried scenario.
Spurred by current alarums, I spent the summer reading and reviewing recent findings of climate science to see if my belief that the somewhat worried scenario as the more likely outcome remains justified. Climate science is a massive enterprise involving research into a vast array of topics including atmospheric physics, ocean and atmospheric currents, solar irradiance, adjustments in temperature records, the effects of atmospheric aerosols, how forests and fields react to rising carbon dioxide, trends in cloudiness, heat storage in the deep oceans, changes in glaciers and sea ice, to name just a few. A simple Google Scholar search using the terms climate change and global warming returns more than 2.6 and 1.7 million results each. Just searching glaciers and climate change returns 124,000 results.
Researchers use complicated computer climate models to analyze all these data to make projections about what might happen to the climate in the future. My reporting strategy has been to take seriously what I believe to be the principal objections made by researchers who argue on scientific grounds that panic is unwarranted. I also assume that everyone is acting in good faith. What follows is based on what I hope is a fair reading of the recent scientific literature on climate change and communications with various well-known climate change researchers.
Ice Age Climate Change
To decide how worried we should be, we need to go back much further than 1992. Starting about 2.6 million years ago the Earth began experiencing ice ages lasting between 80,000 and 120,000 years. The world's most recent glacial period began about 110,000 years ago.
Most researchers believe that variations in Earth's orbital path around the Sun is the pacemaker of the great ice ages. Ice ages end when wobbles in Earth's orbit increase the sunlight heating the vast continental glaciers that form in the northern hemisphere. These orbital shifts initiate a feedback loop in which the warming oceans release of large amounts of carbon dioxide into the atmosphere which in turn further boosts global temperatures. Higher temperatures increase atmospheric water vapor which further boosts warming that melts more ice and snow cover. Less snow and ice enables the growth of darker vegetation which absorbs more heat and so forth.
At the height of the last glacial maximum 19,000 years ago atmospheric concentrations of carbon dioxide stood at only about 180 parts per million. The level of atmospheric carbon dioxide increased to around 280 parts per million by the late 18th century. This chain of feedbacks eventually produced a rise in global average surface temperature of about 4 degrees Celsius. That's the difference between the last ice age in which glaciers covered about one-third of the Earth's total land area and today when only 10 percent of the land area is icebound.
As a result of human activities, the level of carbon dioxide in the atmosphere has risen to about 415 parts per million now. The annual rate of increase in atmospheric carbon dioxide during the past 60 years is about 100 times faster than the rate of increase that occurred at the end of the last ice age. How much this increase is responsible for having warmed the planet over the last century, along with how much more warming will result if carbon dioxide concentrations continue to rise, is the central issue in climate change science.
Just Add Carbon Dioxide
Of course, the sun powers the Earth's climate. About 30 percent of solar energy is directly reflected back into space by bright clouds, atmospheric particles, and sea ice and snow. The remaining 70 percent is absorbed. The air and surface re-emit this energy largely as infrared rays that are invisible to us but we feel as heat.
The nitrogen and oxygen molecules that make up 99 percent of the atmosphere are transparent to both incoming sunlight and outgoing infrared rays. However, water vapor, carbon dioxide, methane, nitrous oxide, and ozone are opaque to many wavelengths of infrared energy. These greenhouse gas molecules block some escaping heat and re-emit it downward toward the surface. So instead of the Earth's average temperature being 18 degrees Celsius below zero, it is 15 degrees Celsius above freezing. This extra heating is the natural greenhouse effect.
NASA climate researcher Andrew Lacis and his colleagues contend that carbon dioxide is the key to greenhouse warming on Earth. Why? Because at current temperatures carbon dioxide and other trace greenhouse gases such as ozone, nitrous oxide, methane, and chlorofluorocarbons do not condense out of the atmosphere. Overall, these noncondensing greenhouse gases account for about 25 percent of the Earth's greenhouse effect. They sustain temperatures that initiate water vapor and cloud feedbacks that generate the remaining 75 percent of the current greenhouse effect. Lacis and his colleagues suggest that if all atmospheric carbon dioxide were somehow removed most of the water vapor would freeze out and the Earth would plunge into an icebound state.
Princeton physicist and lately resigned Trump administration National Security Council member William Happer has long questioned the magnitude of carbon dioxide's effect with respect to warming the atmosphere. In fact, Happer is the co-founder and former president of the nonprofit CO2 Coalition established in 2015 for the "purpose of educating thought leaders, policy makers, and the public about the important contribution made by carbon dioxide to our lives and the economy."His 2014 article, "Why Has Global Warming Paused?" in the International Journal of Modern Physics A, Happer argued that climate scientists had gotten crucial spectroscopic details of how atmospheric carbon dioxide absorbs infrared energy badly wrong. As a result, he asserts, a doubling of atmospheric carbon dioxide would likely warm the planet by only about 1.4 degrees Celsius. If the effect of carbon dioxide on temperatures was indeed constrained to that comparatively low value man-made global warming would probably not constitute a significant problem for humanity and the biosphere.
In 2016, NASA Langley Research Center atmospheric scientist Martin Mlynczak and his colleagues analyzed Happer's claims in a Geophysical Research Letters article and found, "Overall, the spectroscopic uncertainty in present-day carbon dioxide radiative forcing is less than one percent, indicating a robust foundation in our understanding of how rising carbon dioxide warms the climate system." In other words, the details of how carbon dioxide absorbs and re-emits heat are accurately known and unfortunately imply that future temperatures will be considerably higher than Happer calculated them to be.
Another related claim sometimes made is the effect of carbon dioxide on the climate is saturated, that is, the amount of carbon dioxide in the atmosphere is already absorbing re-emitting about as much heat as it can. Consequently, increasing the amount of carbon dioxide in the atmosphere won't much increase the average temperature of the globe. But is this so?
This claim is based on the fact in the current climate era that, as Princeton University climatologist Syukuro Manabe in a 2019 review article "Role of greenhouse gas in climate change," notes, "surface temperature increases by approximately 1.3 degrees C in response to the doubling of atmospheric CO2 concentration not only from 150 ppm [parts per million] to 300 ppm but also from 300 ppm to 600 ppm." To get a further increase of 1.3 degrees Celsius would require doubling atmospheric CO2 concentration to 1200 ppm. A metaphorical way of thinking about this issue is to visualize that the atmosphere consists of layers and as each layer fills up with enough carbon dioxide to absorb all the heat that it can, the extra heat radiates to the next layer that then absorbs it and re-emits it, and so forth. Consequently, the effect of CO2 on temperatures does decline but it does not saturate at levels relevant to future climate change.
Again, an increase of 1.3 degrees Celsius due to doubling carbon dioxide doesn't seem too alarming. "It is much smaller than 2.3 degrees C that we got in the presence of water vapour feedback," notes Manabe. Researchers find under current climate conditions that "water vapour exerts strong a positive feedback effect that magnifies the surface temperature change by a factor of ∼1.8." A warmer atmosphere evaporates and holds more water vapor which again is the chief greenhouse gas. Just as predicted, water vapor in the atmosphere is increasing as average global temperatures rise. Citing satellite data, a 2018 article in Earth and Space Science reported, "The record clearly shows that the amount of vapor in the atmosphere has been increasing at a rate of about 1.5% per decade over the last 30 years as the planet warms."
Evidence Tampering?
Researchers have devised various records to track changes in global average temperatures. These include surface records incorporating thermometer readings on land and at sea; remote sensing of atmospheric trends using satellites, and climate reanalyses to calculate temperature trends for two meters above the surface.
All temperature records must be adjusted since all have experienced changes that affect the accuracy of their raw data. For example, surface temperature records are affected by changes in thermometers, locations of weather stations, time of day shifts in measurements, urban heat island effects, shipboard versus buoy sampling and so forth. Satellite data must be adjusted for changes in sensors and sensor calibration, sensor deterioration over time, and make corrections for orbital drift and decay. Climate reanalysis combines weather computer models with vast compilations of historical weather data derived from surface thermometers, weather balloons, aircraft, ships, buoys, and satellites. The goal of assimilating and analyzing these data is to create past weather patterns in order to detect changes in climate over time. Since climate reanalyses incorporate data from a wide variety of sources they must be adjusted when biases are identified in those data.
Some skeptics allege that the official climate research groups that compile surface temperature records adjust the data to make global warming trends seem greater than they are. A recent example is the June 2019 claim by geologist Tony Heller, who runs the contrarian website Real Climate Science, that he had identified "yet another round of spectacular data tampering by NASA and NOAA. Cooling the past and warming the present." Heller focused particularly on the adjustments made to NASA Goddard Institute for Space Studies (GISS) global land surface temperature trends.
One general method used by climate scientists of adjust temperature records, explains Berkeley Earth climate data scientist Zeke Hausfather (now at Breakthrough Institute) is statistical homogenization. Researchers compare each weather station to all of its nearby neighbors and look for changes that are local to one station, but not found at any others in the area. A sharp sustained jump to either lower or higher temperatures at a particular station generally indicates a change such as a shift in location or a switch in instrumentation. The records of such out-of-line stations are then adjusted to bring it back in line with its neighboring stations.
In general, temperatures increase more rapidly over land compared to the oceans because of the oceans' greater capacity to absorb heat and ability to get rid of extra heat through evaporation. Heller is right that raw land station adjustments by NOAA/NASA have increased overall land warming by about 16 percent between 1880 and 2016. On the other hand, NOAA/NASA adjustments of raw sea temperature data to take account of the shift from measuring ocean temperatures using buckets and intakes aboard ships to a widely deployed network of automatic buoys reduced the amount of warming in past. The adjustments result in about 36 percent less warming since 1880 than in the raw temperature data. When taken together the NOAA/NASA adjustments to land and ocean data actually reduce, rather than increase, the trend of warming experienced globally over the past century. Adjustments that overall reduce the amount of warming seen in the past suggest that climatologists are not fiddling with temperature data in order to create or exaggerate global warming.
It's Definitely Getting Hotter
The latest global temperature trends are compiled in the State of the Climate in 2018 report published in August 2019 by the American Meteorological Society. Since 1979, the surface records from NASA's Goddard Institute for Space Studies (GISS) report an increase of +0.18 C per decade. The both the Hadley Centre of the U.K. Met Office (HadCRUT) and the U.S. National Climatic Data Center finds a rise of +0.17 C per decade; and the Japan Meteorological Agency shows an increase of +0.14 C per decade. In other words, according to surface records the planet has warmed by between 0.7 and 0.55 degrees Celsius in the last 40 years, a difference of 0.15 degrees Celsius.
Back in 2010 University of California, Berkeley physicist and self-proclaimed climate change skeptic Richard Muller founded the nonprofit Berkeley Earth Surface Temperature project aimed at independently checking the temperature trends devised by other research groups. To do so, the Berkeley Earth team created and analyzed a merged dataset by combining 1.6 billion temperature reports from 16 pre-existing data archives derived from nearly 40,000 unique weather stations using raw data whenever possible. In 2013, Berkeley Earth reported a rise in average world land temperature of approximately 1.5 degrees Celsius in the past 250 years and about 0.9 degrees in the past 50 years. In their 2018 report the group finds that since 1980, the overall global trend (land and sea) is +0.19 C per decade and has changed little during this period. Basically, it is slightly higher than the other surface temperature records.
The European Centre for Medium-Range Weather Forecasts (ECMWF) ERA-I reanalysis calculates since 1979 an increase of global average temperature in the lower troposphere (surface to 6 miles up) of +0.14 C per decade; the ECMWF's updated ERA-5 reanalysis reckons a per decade increase of +0.16 C. The Japanese 55-Year Reanalysis (JRA-55) estimates an increase of +0.17 C per decade and NASA's Modern Era Retrospective Analysis for Research and Applications Version 2 (MERRA-2) reports a rise of +0.16 C per decade. The differences in global temperature increase since 1979 between the reanalyses is even narrower ranging from 0.66 to 0.55 degrees Celsius.
The State of the Climate in 2018 reports satellite data temperature trends since 1979 (when satellite measurements began) for the lower troposphere. The University of Alabama in Huntsville (UAH) trend is +0.13 per decade, while Remote Sensing Systems' (RSS) trend is +0.20 degrees per decade. The difference in the two long-term lower tropospheric trends is more substantial. UAH reports warming since 1979 of only about 0.51 degrees whereas the RSS finds an increase of 0.78 degrees Celsius, a substantial difference of 0.27 degrees Celsius.
Which temperature records should be considered as the more accurate is hotly disputed among climate scientists. For example, atmospheric scientist John Christy, one of the developers of the UAH satellite dataset, asserts that it is more accurate because unlike the RSS record it removes spurious warming measurements that occurred as the orbits of a couple of NOAA satellites decayed around the turn of the 21st century. In addition, Christy argues that the UAH temperature dataset has been validated through comparing it to weather balloon temperature data.
It is notable that the four satellite datasets all based on the same raw data find very different global temperature trends. For example, in the lower atmosphere RSS reports about 60 percent more warming than does UAH. Lawrence Livermore National Laboratory climate scientist Stephen Po-Chedley who has helped to develop a different satellite temperature record at the University of Washington observes, "These records are useful, but have substantial uncertainty." The "structural uncertainty" in the satellite records occurs Po-Chedley explains "because researchers use different approaches to remove known biases that affect long-term trends. No method is perfect, which leads to widely varying estimates of atmospheric warming."
Carl Mears, one of the developers of the RSS satellite dataset, disputes claims that the satellite and radiosonde temperature records are more accurate than the surface temperature record. "I consider this to be unlikely (even though I developed one of the satellite records) as indicated by the smaller spread in trends in the surface record than in the satellite record," he states.
The UAH record is something of an outlier with respect to the surface, reanalyses and other satellite records. Of course, that does not mean that it's wrong, but everyone must take into account the balance of the evidence when considering what the rate of global warming has been.
Are Climate Models Running Too Hot?
The differences between the UAH's relatively lower tropospheric temperature increase trend and the generally higher surface trend increases is at the center of a fierce debate over how man-made global warming will play out in the course of this century. The chief researchers who have developed and oversee the UAH satellite dataset are atmospheric scientists John Christy and Roy Spencer. While both acknowledge that adding carbon dioxide to the atmosphere likely does contribute to some warming, they doubt that future climate change will produce an "uninhabitable earth."
Christy and his colleagues argue in a 2018 article that the mid-tropospheric temperature observations in the crucial tropics are way lower than those projected by most computer climate models. Christy summarized his results in a 2019 report, "The Tropical Skies: Falsifying climate alarm," for the U.K.-based Global Warming Policy Foundation. Christy notes that most climate models project significant warming in the tropical troposphere between latitudes 20 degrees north to 20 degrees south of the equator at 30,000 and 40,000 feet.
Christy argues that this missing "tropical hotspot" shows that "the consensus of the models fails the test to match the real-world observations by a significant margin." At a 2017 congressional hearing, Christy had earlier testified, "As such, the average of the models is considered to be untruthful in representing the recent decades of climate variation and change, and thus would be inappropriate for use in predicting future changes in the climate or for related policy decisions."
Christy notes that the average of 102 climate model simulations project tropical troposphere temperature trend of +0.328 C/decade. In the State of the Climate in 2018 report the four decadal satellite tropospheric trends are: UAH +0.12 C; RSS +0.17 C; NOAA +0.22 C, and UW +0.16 C. In addition, the average for the reanalyses is +0.14 C. In other words, the tropical troposphere in the models are warming about two to three times faster than the actual temperatures in the tropical troposphere. On its face, this difference between model projections and temperature data makes Christy's point that the climate models are getting a very important feature related to future global warming badly wrong. Christy's research was cited in an August 2019 op-ed, "The Great Failure of the Climate Models," in The Washington Examiner by climatologist Patrick Michaels and climate statistician Caleb Stewart Rossiter who are now both associated with the CO2 Coalition.
In a 2017 Journal of Climate article, Lawrence Livermore climate researcher Benjamin Santer and his colleagues acknowledged that "model–data differences in the vertical structure of atmospheric temperature change in the deep tropics—is a long-standing scientific concern."Santer and his colleagues published one such effort to address these scientific concerns in a 2017 Nature Geosciences article. In that article, they suggested that the differences between projections and empirical trends occurred due to a combination of fickle natural climate variability, uncertainties in satellite temperature datasets, and sporadic external effects such as cooling from volcanic eruptions that could not be included in the model simulations. Even so, the article concluded, "Our analysis is unlikely to reconcile divergent schools of thought regarding the causes of differences between modelled and observed warming rates in the early twenty-first century." As the ongoing research pursued by Christy and his colleagues shows, divergent schools of thought have indeed not reconciled.
Greenhouse theory predicts that warming at the surface will be amplified in the troposphere due to increased evaporation and convection. Basically, warmer air tends to rise. Climate model calculations project an overall tropospheric warming that is 1.2 times faster than at the surface. In the tropics, where most of the moisture is, the amplification factor is larger, about 1.4 to 1.6.
It is worth noting that Christy is comparing actual tropical temperature trends to modeled temperature trends. Lawrence Livermore atmospheric scientist Stephen Po-Chedley counters that "the model amplification should compare the model surface trend with the model atmospheric temperature trend. And the observed amplification should be the observed surface trend with the observed atmospheric temperature trend." He adds, "When models have sea surface temperatures that are forced to match the observations, the atmospheric warming in those model simulations matches the satellite record."
So let's go to the data. The first column in the table below contains tropical decadal sea surface temperature trends since 1979 between latitudes 20 N and 20 S as measured by four different research groups. In the second column are the actual satellite tropospheric trends over the same region as measured by four different research groups. Averaging the tropical sea surface temperatures yields a rate of increase of about +0.11 C per decade. Multiplying that average by the 1.5 tropospheric warming amplification factor used by the climate models yields a projected increase in tropospheric temperatures of +0.165 C per decade. This is basically in line with the increase of nearly +0.17 C per decade derived from averaging the four tropospheric temperature trends.
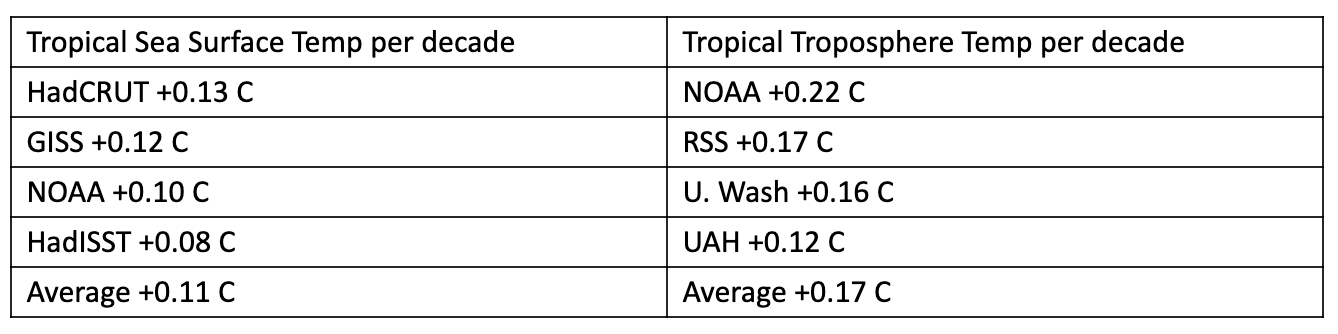
When actual surface data are taken into account, the tropical tropospheric temperature trend rises as pretty much as the models project. On the other hand, it is evident that the models are projecting higher tropical surface temperature trends than have been the case.
In an August 2019 Geophysical Research Letters article, MIT climate scientist Alexandre Tuel sought to explain the differences between recent model and satellite tropospheric warming rates notes that the climate models' projections for the rate of tropical surface warming since 1979 between latitudes 30 N and 30 S is about +0.19 C per decade.
The average rate of tropical surface warming between latitudes 20 N and 20 S for the climate models cited by the IPCC is +0.21 C per decade. Applying the amplification factors of 1.4 to 1.6 yields a projected tropical troposphere temperature increase of +0.27 C to +0.30 C per decade and +0.29 C and +0.34 C per decade respectively. Those figures are about the same as the projected model rate for the tropical troposphere cited by Christy. As Tuel concludes, "The key to explaining recent tropical troposphere temperatures trends lies in understanding why tropical sea surface temperature trends are smaller in models than observations."
So what is going on with the model projections for tropical sea surface temperatures? The mismatch arises chiefly in the vast Pacific Ocean. Generally speaking, due to upwelling colder water the eastern part of the Pacific near South America remains much cooler than the western part near the Philippines and Indonesia (except during El Niño events).
In a June 2019 Nature Climate Change study Columbia University climate researcher Richard Seager and his colleagues note that the models project that rising greenhouse gases will warm the colder east reducing the temperature differences between east and west. However, 60 years of temperature data have actually found that the opposite is occurring, the east is getting cooler and the west is warming up. Seager's team finds that increases in greenhouse gases are having the effect of boosting temperatures in the already warm west which in turn strengthens the winds in the east that intensifies the upwelling of colder water in the east. Seager points out that pattern is akin to La Niña events and will likely drive La Niña-like climate trends worldwide including "drying in East Africa, southwest North America and southeast South America, and wetting in Southeast Asia, Northeast Brazil and the Sahel."
In his Global Warming Policy Foundation report, Christy pointedly observes that the preliminary tropospheric temperature trends are even hotter in the set of 42 climate models whose outputs will be used in the Sixth Assessment Report (AR6) issued by the Intergovernmental Panel on Climate Change in 2021. Although MIT's Tuel has not yet had time to analyze the new model outputs, he says, "I wouldn't be surprised that systematic sea surface temperature biases like the Pacific cold tongue have not been corrected" in that set of models.
Christy and Michaels are certainly right when they point out that the models get tropical tropospheric temperature trends wrong, but the source of the models' error apparently lies in the oceans, not in the skies. The upshot, as Seager notes, is that there is an "urgent need to improve how well state-of-the-art models simulate the tropical Pacific so that the next generation of models can more reliably simulate how it responds to rising GHGs [greenhouse gases]."
Early 20th Century Warming
In their op-ed Michaels and Rossiter note, "Globally averaged thermometers show two periods of warming since 1900: a half-degree from natural causes in the first half of the 20th century, before there was an increase in industrial carbon dioxide that was enough to produce it, and another half-degree in the last quarter of the century." Their implication is that the current warming could be largely natural as well. It is worth noting that the earlier warming (~0.3–0.4 degrees C) was actually about a third to a half of the warming since the 1970s (~0.8–0.9 degrees C).
In addition, an August 2019 article in the Journal of Climate by Oxford University climate data scientist Karsten Haustein and his colleagues analyzed the evolution of temperature trends during the 20th century. They concluded that the early warming and mid-century cooling interludes could be almost entirely explained once the effects of rising aerosol pollutants, periodic volcanic eruptions, and spurious warming in some sea surface temperature records were accounted for. If they are right, warming due to accumulation of greenhouse gases has been proceeding for more than a century and is speeding up. Of course, it's early days, so it remains to be seen if these results stand the test of time and further analysis.
The Global Warming Hiatus
The increase in average global temperature appeared to slow down dramatically between 1998 and 2015 even as greenhouse gases continued steadily to accumulate in the atmosphere. The IPCC's 2014 Synthesis Report acknowledged that the rate of surface warming since 1998 had been only 0.05 degrees Celsius per decade, which is considerably lower than the 0.12 degrees Celsius per decade rate observed since 1951. This "hiatus" was seen as evidence by skeptics (and reported by me) that climate model projections of fast and dangerous man-made warming were way overblown. For nearly a decade most climate researchers ignored the hiatus handwaving that warming would soon resume as projected. Eventually, the mismatch could no longer be ignored. Perplexed researchers sought to explain the slowdown in articles that placed the blame on a range of possibilities spanning from changes in solar radiation and stratospheric water vapor to burying excess heat in the deep oceans and natural internal variations in climate. By 2016, researchers had published nearly 200 peer-reviewed studies on the topic.
In the course of this research, many climate scientists came to realize that comparing the lower global temperature trend to the climate model average was obscuring the fact that many of the models actually produced internal climate variability with slowdowns very much like the hiatus. In fact, global climate model runs indicated that internal variability in ocean temperatures and heat uptake can mask long-term man-made warming for periods lasting more than a decade. As discussed above, that seems to be what caused the divergence between model and observed tropical temperature trends. In addition, updates and corrections to surface temperature records later made it clear that warming largely unnoticed had actually continued more or less unabated.
In fact, research by University of Exeter climate data scientist Femke Nijsse and her colleagues published in the July 2019 Nature Climate Change counter-intuitively finds that "high-sensitivity climates, as well as having a higher chance of rapid decadal warming, are also more likely to have had historical 'hiatus' periods than lower-sensitivity climates." By high sensitivity, Nijsse means that average global temperature could potentially increase by +0.7 C in just one decade. If she is right, the early 21st century hiatus could literally be the cooler calm before the warming storm.
In any case, the hiatus came to an end when a super El Nino event in the Pacific Ocean substantially boosted global temperatures making 2016 hottest year since more or less accurate instrumental records started being kept in the 19th century. Even in the lower trending UAH dataset, 2016 edged out 1998 by +0.02 C to become the warmest year in that 38-year satellite record. Christy did observe that "because the margin of error is about 0.10 C, this would technically be a statistical tie, with a higher probability that 2016 was warmer than 1998."
During the hiatus period, Christy argued that the climate models were clearly wrong because their projections were warming the bulk atmosphere at about twice the rate reported by satellite and balloon temperature trend observations. However, the 2016 El Nino event pushed the model projections and observational temperature trends more or less into alignment. In November, University of Guelph economist and frequent Christy scientific collaborator Ross McKitrick asserted, "The El Nino disguised the model-observational discrepancy for a few years, but it's coming back." McKitrick evidently expects that as the effects of the last El Nino ebb it will become undeniable by around 2030 that the models are projecting much too much warming.
On the other hand, in an April 2019 International Journal of Climatology article, a team of Chinese atmospheric scientists try to figure out how the long-term warming trend affected both the 1998 and 2015/2016 super El Ninos and what that suggests about future warming. Using five different surface datasets they calculate that in 1998 the El Nino event added +0.18 C to the long-term warming trend whereas in 2016, that El Nino event added just +0.06 to the long-term warming trend. In other words, it took a lot less heat to boost the 2015/2016 El Nino to slightly above the level of the 1998 El Nino. They report that their analysis "implies that warmer years like 2014–2016 may occur more frequently in the near future. We conclude that the so-called warming hiatus has faded away." If these researchers are right, future El Ninos may well temporarily boost global temperature trends above the model projections. In which case McKitrick's expectations that model results and observational trends will again significantly diverge over the coming decade are likely to be disappointed.
The record warmth of 2016 has so far not been exceeded, but surface temperature records report that nine of the 10 warmest years have occurred since 2005, with the last five years comprising the five hottest.
Rising Seas
One possible consequence of man-made global warming is that the melting of glaciers and the Greenland and Antarctic ice sheets will boost sea level and inundate coastal cities. It is generally agreed that the oceans over the past century have risen by an average of about 7 to 8 inches. Former Georgia Tech climatologist Judith Curry issued in November 2018 a special report, Sea Level and Climate Change. Curry concluded that recent changes in sea level are within the range of natural variability over the past several thousand years and there is not yet any convincing evidence of sea-level rise associated with human-caused global warming.
The IPCC's AR5 report suggested that average sea level rose by 7.5 inches between 1901 and 2010. The IPCC also reported that sea level very likely rose at a rate of about 1.7 millimeters (0.07 inch) per year between 1901 and 2010, but had accelerated to 3.2 millimeters (0.13 inch) between 1993 and 2010. If the rate does not increase, that would imply that sea level would rise by an average of 10 inches by 2100. In fact, that is the IPCC's low-end estimate while its high-end projection is nearly 39 inches depending on how much extra carbon dioxide is emitted into the atmosphere during the rest of this century.
A February 2018 study in the Proceedings of the National Academy of Sciences based on satellite altimeter data reported that sea-level rise at 3 millimeters per year has accelerated at a rate of +0.084 millimeters (about 1/20th the thickness of a penny*) since 1993. If sea level continues to change at this rate and acceleration, the researchers estimate that average sea-level rise by 2100 will be closer to 24 inches than 10 inches in 2100.
Curry counters, however, that the calibrations to the satellite altimeter data are far larger than the resulting changes in global mean sea level reported in that study. Be that as it may, another study in Nature Climate Change published in August 2019, found "persistent acceleration in global sea-level rise since the 1960s." The new study reports that sea-level rise has been accelerating at a rate of 0.06 millimeters per year since 1960, bolstering the earlier finding that sea level increase is accelerating. All things considered, Curry concludes that "values exceeding 2 feet are increasingly weakly justified." In other words, Curry also accepts that sea level could possibly rise about three times more than it did over the last century.
All Models Are Wrong
So even though the models appear essentially OK with respect to their tropical troposphere projections once actual sea surface temperatures are inputted, do their mistaken Pacific Ocean surface temperature projections invalidate them? The Science and Environmental Policy Project headed by climate change skeptic Kenneth Haapala "questions the use of models for public policy unless the models have been appropriately verified and validated. No matter how elaborate, the results from numerical models that are not thoroughly tested against hard evidence are speculative and cannot be relied upon." So what would count as validating climate models?
One commonplace notion is that scientific validation is achieved only when researchers develop a hypothesis and then design experiments to test it. If the experimental data contradict the hypothesis, it is rejected (or at least reformulated). Climate science however is an observational, not an experimental, science. In a sense, climate models are gigantic hypotheses, but the empirical data with which to check their predictions lies in the future.
Swiss Federal Institute of Technology environmental philosopher Christoph Baumberger and his colleagues address in their 2017 WIREs Climate Change article the issue of building confidence in climate model projections. They note that the most common way to evaluate climate models is to assess their empirical accuracy (how well model results fit past observations), robustness (how well they match the outputs of other models), and coherence with background knowledge (the support of model equations by basic theories). Nevertheless, they acknowledge that these three assessment criteria "neither individually nor collectively constitute sufficient conditions in a strict logical sense for a model's adequacy for long-term projections."
With respect to the adequacy of climate models (or of any other models for that matter), keep firmly in mind British statistician George Box's aphorism, "All models are wrong, but some are useful." Climate models certainly serve the heuristic function of helping climate researchers to better understand over time the feedback effects of the mind-bogglingly complicated interconnections between the atmosphere, the oceans, and the land. But how have they done with global warming projections?
Fairly well it turns out, according to a forthcoming evaluation by climate data scientist Zeke Hausfather and his colleagues of the projected warming trends in 17 different historical climate models published between 1970 and 2007. In their analysis the researchers also took into account mismatches between actual carbon dioxide emissions and other factors (effects of volcanic eruptions) that the modelers could not anticipate in order to assess the performance of the models' physics. The result was that 14 of the 17 model forecasts were consistent with the trends in the range of five different observational surface temperature time series.
Many critics have pointed out this notable emissions trajectories mismatch. Actual economic growth patterns during the past decades strongly suggest that future emissions will more closely track those projected by the more moderate IPCC scenarios and that the specific scenario featuring high emissions is exceedingly implausible. In the high emissions scenario, energy efficiency and carbon intensity (the amount of carbon dioxide emitted per dollar of GDP) gains that have been advancing for decades stall and the global energy system improbably re-carbonizes rapidly as it burns ever more coal, natural gas, and oil. Unfortunately, in many climate science studies and in popular reporting, outputs based on the high emissions scenario have been often treated as plausible business-as-usual projections instead of dubious worst-cases. One hopes that more credible socioeconomic and emissions scenarios will be developed as inputs for the next round of climate modeling to be used for the IPCC's upcoming Sixth Assessment Report.
In July, a so-far non–peer reviewed study by several young climate researchers at MIT report similar results when they assessed the projections of the 15 climate models used in the IPCC's Second Assessment Report (SAR) back in 1995. Their study aims to "probe the relationship between model hindcast skill and model forecast skill." In other words, do models that get trends in the past right also tend to get future trends right?
In order to figure out how well SAR models projected "future" temperature trends, the MIT researchers compare the model projections made back in 1995 to the observed global warming temperature trends between 1990 and 2018. They find that multi-model mean of the models "accurately reproduces the observed global-mean warming over a 1920-1990 hindcast period and accurately projects the observed global-mean warming over the 1990-2018 nowcast period." On that basis they boldly conclude, "Climate change mitigation has now been delayed long enough for the first projections of anthropogenic global warming to be borne out in observations, dismissing claims that models are too inaccurate to be useful and reinforcing calls for climate action." They do dryly observe that whether increasingly complicated modern models will prove to be more accurate "is yet to be determined." As we shall see below this may be a live issue with the set of models being used for the IPCC's Sixth Assessment Report in 2021.
While past performance is no guarantee of future results, at least with respect to projecting global average temperature trends, these historical climate models appear to have met the confidence building tests of empirical accuracy, robustness, and background knowledge coherence. In other words, they have proven useful.
The Cloud Wildcard
About 30 percent of incoming sunlight is reflected back into space with bright clouds being responsible for somewhere around two-thirds of that albedo effect. In other words, clouds generally tend to cool the earth. However, high thin cirrus clouds don't reflect much sunlight but they do slow the emission of heat back into space, thus they tend to warm the planet. In the current climate, clouds reflect more sunlight than they absorb and re-emit as heat downward toward the surface, so that on balance the earth is cooler because it has clouds than it would be than if it had no clouds.
In his 2018 lecture "The Role of Clouds in Climate," NASA Goddard Institute for Space Science atmospheric scientist Anthony Del Genio notes, "It has often simplistically been assumed that clouds will offset greenhouse gas-induced climate change, based on the logic that warming evaporates more water from the ocean, which causes more clouds to form, which increases the albedo, which offsets the warming." However, most computer climate models project total cloud climate feedbacks ranging from near-neutral to strongly positive. What's going on?
How clouds will react to warming is one of the largest feedback uncertainties with respect to future climate change. The processes that form clouds are below the spatial resolution of climate models so researchers make estimates of how much sunlight they reflect and how much they absorb and then input those values into the models. The balance between cloud reflection and absorption matters a lot.
Researchers at the Pacific Northwest National Laboratory for example in a 2004 Journal of Applied Meteorology article noted that "a 4% increase in the area of the globe covered by marine stratocumulus clouds would offset the predicted 2–3 [degree C] rise in global temperature due to a doubling of atmospheric carbon dioxide." Marine stratocumulus clouds commonly form over cold ocean waters off the west coasts of continents. They are generally thin low clouds and cover more of the Earth's surface than any other cloud type making them extremely important for Earth's energy balance, primarily through their reflection of solar radiation.
On the other hand, wispy cirrus clouds that occur up to 20 kilometers above the surface let sunlight through but absorb and reflect infrared back downward to heat the surface. In 2001, MIT climatologist Richard Lindzen and his colleagues pointed to evidence in a Bulletin of the American Meteorological Society that cirrus clouds over the tropics tended to dissipate as temperatures increased. Such a process would serve as a negative feedback that, according to Lindzen and his colleagues, "would more than cancel all the positive feedbacks in the more sensitive current climate models." They likened this process to "an adaptive infrared iris that opens and closes in order to control the Outgoing Longwave Radiation in response to changes in surface temperature in a manner similar to the way in which an eye's iris opens and closes in response to changing light levels."
On the other hand, newer research suggests that rising temperatures will tend to dissipate low marine stratocumulus clouds which would generate a positive feedback that increases warming. In addition, changes in where clouds are located have big feedback effects. Climate models predict and preliminary satellite data finds that mid-latitude storm tracks (and their clouds) are retreating poleward, subtropical dry zones (deserts) are expanding, and the height to the highest cloud tops are rising. All three processes tend to increase global warming. "The primary drivers of these cloud changes appear to be increasing greenhouse gas concentrations and a recovery from volcanic radiative cooling," conclude Scripps Institution of Oceanography climatologist Joel Norris and his colleagues. "These results indicate that the cloud changes most consistently predicted by global climate models are currently occurring in nature."
Two different groups have lately revisited Lindzen's iris effect. One team in 2017 reported finding that increased sea surface temperatures boosted precipitation over the tropics. This, in turn, tended to reduce cirrus cloud cover allowing more infrared to escape into space which resulted in cooling. More recently, another group in 2019 analyzing trends in the western Pacific found that increasing sea surface temperatures tended to increase the amount of cirrus cloud cover slightly, generating a positive warming feedback.
Even though the details of how changes in clouds will affect future climate are still unsettled, Del Genio argues, "It is implausible that clouds could substantially offset greenhouse warming at this point in history." Why? "There is just no plausible physical mechanism that we can point to that would do that, nor is there any evidence in data that such a mechanism exists, nor is there any way one can possibly explain the observed warming of the past 60-70 years if that is the case," he explains.
More worryingly recent climate model research suggests that high atmospheric concentrations of carbon dioxide (1200 parts per million) could yield a tipping point in which cooling stratocumulus clouds are vastly dissipated. Such a break-up of low-level clouds would trigger a surface warming of about 8 C globally and 10 C in the subtropics. This scenario was bolstered by a September 2019 study in Science Advances seeking to simulate the climate of the Paleocene-Eocene Thermal Maximum (PETM) some 56 million years ago. Geological evidence indicates during the PETM that carbon dioxide levels were around 1,000 parts per million and that the Earth's surface was then at least 14 degrees Celsius warmer on average than it is now. The poles were ice-free. The research suggests that increases in carbon dioxide during the PETM produced a feedback process that greatly reduced low-level clouds which in turn further substantially boosted surface temperatures.
Ultimately Del Genio observes, "We think that clouds are likely to be a positive feedback, but we are not yet sure whether they are a small or large positive feedback. They could even be neutral. Many of the most recent climate models are predicting a fairly large cloud feedback (our GISS model is not one of them), but the jury is out on whether that is a reasonable result or not."
The Most Important Number
Scientific American in 2015 called equilibrium climate sensitivity "the most important number in climate change." Equilibrium climate sensitivity is conventionally defined as the increase in Earth's average surface temperature that would occur if carbon dioxide concentrations in the atmosphere were doubled and the climate system was given enough time to reach an equilibrium state. In 1979, the Charney Report from the U.S. National Academy of Sciences first conjectured that ECS was likely somewhere between 1.5 C and 4.5 C per doubling of CO2. The Intergovernmental Panel on Climate Change's Fifth Assessment Report (AR5) published in 2013 concluded that ECS is likely to be 1.5 C to 4.5 C. That is, nearly four decades later, the best estimate of sensitivity is largely the same.
Since the Charney report, climate researchers have reported more than 150 estimates of equilibrium climate sensitivity (ECS). Although the AR5 report did not offer a best estimate for ECS, the average for the models used in that report is 3.2 C. Just in 2018, statistician Nicholas Lewis and climatologist Judith Curry published in the Journal of Climate a median ECS estimate of 1.66 C with a range of 1.15–2.7 C.This is well below the IPCC's range and about half of the model average.
However, Texas A&M climate scientist Andrew Dessler and his colleagues also in 2018 estimated in the Journal of Geophysical Research: Atmospheres that median ECS was 3.3 C and likely ranged between 2.4 to 4.6 C. They added, "We see no evidence to support low ECS (values less than 2C) suggested by other analyses. Our analysis provides no support for the bottom of the Intergovernmental Panel on Climate Change's range." Another group of researchers associated with MIT estimated in 2006 that upper bound of ECS could be as high as 8.9 C. That figure is basically twice the temperature increase that ended the last ice age.
The ECS estimates in the lower range generally are derived from analyzing historical temperature observations. University of Reading climate modeler Jonathan Gregory and his colleagues published a study in October arguing that the historical temperature data upon which they are based may be skewed downward by, among other things, an anomalously cooler historic period due to internal climate variability along with the additional cooling effects of industrial aerosol pollutants and volcanic eruptions. However, independent climate research statistician Nicholas Lewis recently countered that Gregory and his colleagues used flawed statistical methods to obtain their results. Time will tell how this shakes out.
There is great socioeconomic value in pinning down ECS. The larger that ECS is, the faster temperatures will increase and the higher they will go. The upshot is that the higher that ECS is, the worse the effects of climate change are liable to be. Conversely, the smaller ECS is, the slower that temperatures will rise and the lower they will go. A smaller ECS would mean that humanity has more time to address and adapt to future climate change. It is worth noting that the ECS values used in the historical models evaluated by Hausfather and his colleagues fit within the IPCC's AR5 range.
Researchers relying on three strands of evidence that include increased understanding of climate feedbacks, the historical climate record, and the paleoclimate record find that they are together pointing toward a narrower span of plausible ECS boundaries. These analyses are converging on a likely ECS ranging between 2.2 to 3.4 C and further indicate a very likely ECS range of between 2 C to 4 C. If this research proves out, this is good news since it would strongly imply that the higher and much more catastrophic ECS projections are improbable.
But hold on, some preliminary ECS estimates from the set of 42 next-generation climate models that the IPCC will be referencing in its 2021 Sixth Assessment Report (AR6) are considerably more worrisome. Currently several of those models are reporting an ECS of 5 degrees Celsius or hotter. The researchers, who are not at all sure about why their models are producing these results, are probing further to see if the high estimates will stand after deeper scrutiny.
Over at RealClimate NASA Goddard Institute for Space Studies director Gavin Schmidt urges caution before accepting these preliminary model results with respect to ECS. "Why might these numbers be wrong?," he asks. "Well, the independent constraints from the historical changes since the 19th C, or from paleo-climate or from emergent constraints in [earlier climate] models collectively suggest lower numbers (classically 2 to 4.5ºC) and new assessments of these constraints are likely to confirm it."
In fact, as noted above the latest assessments of ECS based on historical, paleoclimate, and feedback data have narrowed the range of estimates considerably below these new model outputs. "For all these constraints to be wrong, a lot of things have to fall out just right (forcings at the LGM [last glacial maximum] would have to be wrong by a factor of two, asymmetries between cooling and warming might need to be larger than we think, pattern effects need to be very important etc.)," points out Schmidt. "That seems unlikely."
Conclusions
Assuming that the new much higher ECS estimates do happily turn out to be wrong, the earlier ECS estimates still suggest that it is unlikely that humanity can avoid substantial climate change if the atmospheric concentration of carbon dioxide doubles over the pre-industrial level of 280 ppm, that is, 560 ppm. In recent years, carbon dioxide has been increasing in the atmosphere at an annual rate just under 3 parts per million (ppm) reaching 415 ppm this year. If that rate of increase continues, it will take about 50 years to reach 560 ppm.
So, what would the average global temperature be around 2070 when atmospheric carbon dioxide has doubled? This is where another quantity, transient climate response (TCR), becomes relevant. TCR is generally defined as what the average global temperature would be when carbon dioxide atmospheric concentrations growing at 1 percent per year reaches the doubling point over a period of about 70 years. The average TCR is 1.8 C in models cited in the IPCC's AR5 report. Not surprisingly, the lower the ECS is calculated to be, the lower the TCR will be. For example, Lewis and Curry calculated their median TCR as 1.2 C (range 0.9 to 1.7 C).
Considering that the planet has already warmed by about a degree Celsius as the atmospheric carbon dioxide concentration rose by 45 percent, lower TCR estimates seem unlikely. Assuming that global warming proceeds at the NOAA rate of +0.17 C per decade that adds up to an increase of around +0.85 C by 2070. Since average global temperatures have increased by 1 C since the late 19th century an additional +0.85 would more or less match the climate model TCR average of 1.8 degrees per doubling of carbon dioxide. Of course, the warming wouldn't stop then.
"Is it too late (to stop dangerous climate change)?," asks University of Cambridge climate researcher Mike Hulme in his October editorial introducing a special issue of the journal WIREs Climate Change devoted to the question. Given how long I have been reporting on climate change, I identify with his world-weary observation, "There is a long history of climate deadlines being set publicly by commentators, politicians and campaigners…and then of those deadlines passing with the threat unrealized."
Hulme pointedly notes that "deadline-ism" as embodied in the Green New Deal "does not do justice to what we know scientifically about climate change." Climate change prediction science reports "a range of possible values for future global warming. It is as false scientifically to say that the climate future will be catastrophic as it is to say with certainty that it will be merely lukewarm." He adds, "Neither is there a cliff edge to fall over in 2030 or at 1.5 degrees C of warming."
Continued economic growth and technological progress would surely help future generations to handle many—even most—of the problems caused by climate change. At the same time, the speed and severity at which the earth now appears to be warming makes the wait-and-see approach increasingly risky.
Will climate change be apocalyptic? Probably not, but the possibility is not zero. So just how lucky do you feel? Frankly, after reviewing recent scientific evidence, I'm not feeling nearly as lucky as I once did.
*CORRECTION: The original version of this article overstated the fraction of a penny thickness represented by +0.084 millimeter rate of increase in rising sea level.


