How Common Are Church Arsons?
More common than you probably think, less common than they used to be

Shortly after a white supremacist murdered nine people at a Charleston church in June, the Southern Poverty Law Center sounded an alarm: A rash of fires was breaking out at black churches. Word of the apparent epidemic spread through the media, but then a counternarrative started to emerge. After describing one of the blazes that had attracted the public's attention, a Washington Post piece pointed out that the fire in question
wasn't arson, and there have been a number of fires at non-black churches since June 20, too—including arsons. It seems that the reported trend is more a function of our habit of seeking out patterns than any abnormal targeting of black churches.
"Abnormal" is an important word there. A 2000 investigation into church arsons found 945 examples between January 1995 and that August—an average of 14 a month. In the South, those fires were disproportionately at churches with black congregations. Other data suggests that arsons at churches could occur as often as five times a week.
The story went on the make a good case that what we were witnessing was not a wave of arsonists attempting to follow in the footsteps of the Charleston killer, but a wave of press attention for a sort of event that happens more frequently than most people suspected. While this was reassuring as far as fears of copycat assaults were concerned, it did leave us with a depressing thought: Holy crap. Just how common are church arsons?
The Pew Research Center has now offered a broader answer to that question, analyzing data from the Bureau of Alcohol, Tobacco, Firearms, and Explosives:
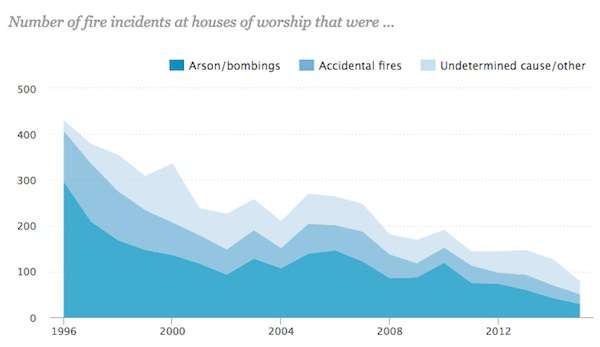
In the last two decades, apparently, the number of fires at churches and other houses of worship has strongly declined, but the share of those fires attributed to arsonists or bombers has been fairly stable. (Though obviously, we don't know how many fires with undetermined causes were set on purpose.) Totalling all of these fires from 1996 to 2015, Pew reports that 51 percent have been ruled intentional. That's an unusually high proportion:
Fires caused by arson are far more common at houses of worship than in most other kinds of structures. For instance, in 2013, only about 10% of all nonresidential fires and 5% of residential fires were intentionally set, according to the Federal Emergency Management Agency.
One question these data do not address is how many of those church arsons can be classified as hate crimes, as opposed to being driven by revenge, insurance fraud, the concealment of a burglary, or some other motive.
If you look at all fires, by the way, the news is good. According to FEMA, the total number of fires fell 19.5 percent from 2002 to 2011, and the number of people killed in those incidents declined 20.6 percent—though the death numbers jumped for a few years early in the decade before coming down later on. For more FEMA fire stats, go here.


