The Volokh Conspiracy
Mostly law professors | Sometimes contrarian | Often libertarian | Always independent
"Consumer Credit and the American Economy," Part 2: Long-Term Trends in Consumer Credit Use
This essay continues a short review of some ideas discussed at greater length in Consumer Credit and the American Economy, a new book by Thomas A. Durkin, Gregory Elliehausen, Michael E. Staten, and Todd J. Zywicki (Oxford University Press, August, 2014). The first essay examined economic reasons why consumer credit use is widespread. It does not follow that credit use is excessive, however, or that it has been increasing alarmingly, or even at all relative to other economic quantities during this period. This essay looks at this question.
Consumer Credit Growth
Limited systematic empirical examination suggests that communications media pronouncements about consumer credit growth have generally been dismal. This is not to establish a straw man for attack and it is difficult to estimate how influential such statements have been, if at all, but even the casual empiricism of asking one's neighbors for their views of the domestic consumer credit picture reveals the widespread notion that credit for consumers simply has grown too fast for too long. This claim is hardly new and it is easy enough to find examples over decades. This, in turn, raises another empirical question: What actually has been the growth picture in the consumer credit area?
Certainly in nominal terms consumer credit has grown in the postwar era. From a total of $6.8 billion in current dollars at the end of 1945, consumer credit outstanding grew to more than $3 trillion at the end of 2013. This clearly is a significant amount, which, of course, is not necessarily the same as being a meaningful worry. Many other economic magnitudes have also risen sharply in the years since World War II, including population, employment, income, assets, and wealth. Comparison of consumer credit to other economic magnitudes, rather than looking at absolute amounts of credit, helps to put the changes into better perspective.
Before examining measures of credit growth, it is worth noting first that economic studies employing sophisticated theoretical and statistical approaches have failed to produce hard evidence from past experience that consumer credit growth has led to the biggest expressed concern: that such growth leads to decreases in future spending and causes or dramatically accentuates macroeconomic recessions. If anything, available evidence is to the contrary. Econometricians who have investigated the relationship between the payment "burden" of consumer credit arising from repayments and subsequent evidence of consumer spending have found that consumer credit growth actually is positively related to consumption in future periods. It seems that this positive relationship comes about because consumer credit rises when consumers are optimistic about economic prospects rather than pessimistic about present conditions, including the current burden of debt.
As indicated, it is possible to compare consumer credit versus other economic magnitudes in a variety of ways. Such comparisons show that after a post-World War II surge due to ending wartime restrictions on both durable goods like automobiles and appliances and also on credit, these measures have risen hardly at all in decades.
One of the interesting comparisons over time involves a Federal Reserve measure of the ratio of payments to income known as the "Debt Service Ratio" (DSR). Analysts have contended that a measure of payments burden is better than a ratio of the amount of consumer credit outstanding because the payment ratio directly represents the relationship between outgoing resources necessary to avoid debt default and incoming resources available to meet the obligations.
Calculation of the consumer credit DSR over time shows that even with inclusion of student loan debts after 2003, the measure is trendless since first calculated for the year 1980 (see chart).
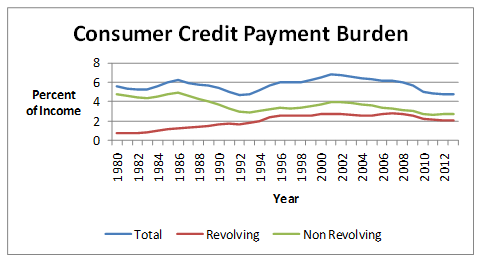
Careful examination of the consumer credit DSR also shows that the DSR arising from credit card credit appears largely to be a replacement for declining DSR on older kinds of installment credit now employed less often for smaller and medium-ticket purchases (also visible in chart). This is not to say that no consumers have debt difficulties. During recessions, and especially at year-end holiday season, the news media are filled with feature stories about debt burdens and other sadness of the unemployed, but as sad as these cases are they do not represent anything close to the majority of consumer credit users. Including mortgage credit in a combined DSR for both kinds of credit raised the combined ratio about five percentage points 1980-2007, but following the mortgage dislocations in the sub-prime area in 2008-9, the combined ratio has returned again to its 1980 level (not in chart). Undoubtedly the flatness in the consumer credit DSR ratio arises in part from the lengthening of consumer credit maturities that has taken place over time, but the result is that the consumer credit DSR is trendless.
Another way to look at consumer credit growth is to array yearly growth rates over a period of time to see if there have been anomalous (or even worrisome) sub periods. Doing so since 1946 makes it immediately apparent that credit growth has not been steady in the postwar period; annual growth rates for both consumer and mortgage credit have fluctuated over the postwar business cycles. Possibly more interesting is how the cyclical episodes have been relatively similar over time. Nonmortgage consumer credit annual growth peaked in each cyclical upswing after 1955 at roughly a 15-17 percent growth rate, with the all-time highs in the earliest postwar period when it was responding to the end of wartime controls during the 1940s. Notably, there has not been a long term sharp uptrend in growth rates in either the consumer or mortgage credit series. Although the relative consistency of pattern does not provide a forecast, it is at least an indication that recent growth patterns in consumer credit are not anomalous or startling in percentage terms. Consumer and mortgage credit grew rapidly in recent cyclical upswings, but they always have done so in upswings before falling off to growth rates around zero in downswings. Possibly the most noticeable change has been the sharp decline in mortgage credit growth after 2004 to negative territory beginning in 2008. Although the negative growth numbers for mortgage credit are new, a multiyear decline in growth rate is not.
There are further comparisons that can help to put credit growth in perspective and a variety of approaches to reporting the statistical comparisons. Fortunately, the various methods lead to the same general conclusion.
Debt at any instant is a certain amount outstanding. Quantities that are fixed at a point in time are known in economics as "stock" items. Common examples include the money stock (the amount of currency and deposits or other definition of money that the public holds at a given time), the amount of pension assets in individuals' IRA and 401k accounts at the end of a year, the amount of bank assets subject to reserve requirements, the total public debt of the United States, etc. In contrast, the variation in a stock from one time to another is a change measure, an amount per period of time, and is known as a flow. Income, for example, is a "flow" measure, consisting of the change in a person's or the economy's financial condition (wealth) over a period such as a year. The change in credit outstanding over a year is another flow measure.
This distinction between stocks and flows immediately suggests four basic kinds of comparisons that might be made among economic quantities: stock to stock, stock to flow, flow to stock, and flow to flow. Discussion above focused on a particular flow to flow comparison, the ratio of consumer credit repayments to income (the DSR). When journalists compare consumer debt outstanding to something else, they often use a certain stock to flow ratio, debt outstanding relative to income. Both of these comparisons can be interesting, but they are not the only ones available and others also are illustrative. Candidates for further comparisons include both stock and flow ratios of consumer credit to other important consumer balance sheet and income statement quantities: to specific assets, total assets, wealth, and the change in wealth (income). But without going into detail here on each kind of measure separately (information with charts that is available in the book), close examination of all four potential types of ratios for comparing aggregate consumer financial statistics (stock to stock, stock to flow, flow to stock, flow to flow) produces essentially the same conclusion concerning experience with consumer credit in recent years: recent trends are quite similar to experience in earlier decades.
In sum, none of the statistical methods of comparing consumer credit outstanding or changes in consumer credit outstanding produces a conclusion that recent experience is startling or obviously problematic. Furthermore, although economic studies including econometric studies of long-term growth of consumer credit have not been especially numerous over the years, there have been some serious studies in this area that go beyond just outlining the basic statistical trends as above. While most of these studies are rooted in the specific questions and issues of the times when they were written, serious analysts have reached similar conclusions concerning the generally benign nature of long term growth of consumer credit, regardless of the time period covered by their individual efforts.
From the discussion so far it is not obvious that consumer credit growth in the post World War II years warrants the gloomy assessments sometimes associated with it, whether expressed in dollars or in typical analytic form as an aggregate ratio of credit outstanding to some other relevant quantity. Neither the trends in the ratios themselves nor the conclusions of the serious analysts of consumer credit give clear reasons for the expressions of concern so often articulated in other quarters. There still are distributional questions, however, because, by themselves, the aggregates do not indicate how the debt and income may be spread among an economically diverse population. A potentially disturbing possibility is that income growth, for instance, may not accrue to the same consumers who increase their credit use. Credit use may only occur among lower income consumers, for example, while only higher income individuals receive pay raises and become better off financially, maybe never needing to use credit. Or, the relationships among credit users and income earners may change over time (for better or worse). Because of such questions, it is useful also to look at cross section evidence that arrays the holdings of debts and the reception of income.
The Federal Reserve Board's Surveys of Consumer Finances show that there has been growth in consumer credit use in all income and age segments 1951-2010. Among income quintiles, the greatest relative growth in frequency of credit use occurred in the two lowest income quintiles 1951-1963, but since then growth in the credit using population has been slight in these groups and only moderate in the upper income groups. Each of the three highest income groupings registered half or more of their members as consumer credit users in as long ago as 1951, and the proportion in the third and fourth quintiles reached two-thirds by 1963. Only the two highest income groups show any noticeable growth in the proportion of consumer credit users since then, at about five percentage points in both groups. Examination of the shares of consumer credit owed by the various income quintiles also shows great stability since the 1950s.
In conclusion, consumer credit use has grown sharply in the post-World War II era, but not very much relative to income or assets since the early 1960s. Historical patterns in these ratios have been intensely cyclical, however, which likely at least partially explains why there are expressions of concern when they rise, despite lack of firm evidence that rising debt ratios have led to economic calamity. Debt growth has occurred in all income and age groups, but the bulk of consumer credit outstanding currently is owed by the higher income population segments, much as in the past. The two lowest income quintiles taken together owed about 23 percent of consumer credit in 2010 about the same as in 1956, although there was an uptick for the lowest quintile in 2010. The share of consumer credit outstanding owed by the upper income fifth of the income distribution was 33 percent in 2010, not much different from 1951, despite interim fluctuations.
Tomorrow: Behavioral Analysis of Consumer Credit Use