Two "axioms" of economics have always seemed to make a lot of sense. One, the quantity theory of money, relates changes in the price level to changes in the quantity of money available to the marketplace. The other says that government mishandling of the economy is the root cause of inflation. Unfortunately, experience in recent years has tended not to support the first axiom: growth in the normal measures of money supply has not kept pace with prices. And if that's true, then the other axiom—because government has so much to do with the money supply—may be wrong too.
Differential growth rates have become pronounced over the last five years. The Consumer Price Index has grown 46 percent while the M1 money supply has expanded only 31 percent. This means that prices increased almost half again as fast as the M1 money supply—not a very convincing statistic in support of the quantity theory of money.
True, a change in the trend of M1 growth correlates well with changes in price levels, but that's not enough to prove the proposition. Moreover, "lead/lag," "M2, M3, etc.," and similar refinements sound more desperate than valid.
So, should we abandon these two honorable economic theories? No! They make too much sense to be in error. There must be something wrong with our proof. And indeed there is.
EXPLODING DEBT
We've been working with an unduly restricted definition of money. To find proof for our propositions, turn to Milton Friedman's observations in A Monetary History of the United States. There he says that money is basically "a temporary abode of purchasing power enabling the act of purchase to be separated from the act of sale." Later, he alludes to the growth of money substitutes in the United States after World War II. And, interestingly, throughout he measures money in terms of debt—as a store of value for creditors.
Friedman's definition implies that all temporary abodes of purchasing power are potential money. And changes in our debt and money markets since World War II have converted all forms of debt into short-term parking lots for cash. So we can conclude that we've mobilized our debt—we've effectively activated all that potential money. The result has been an exploding "debt-money" supply and today's inflation.
Mobilizing debt and converting it to money has become a major national pastime. Consumer finance companies borrow against short-term debentures to fund intermediate- and long-term auto loans. Lending institutions collect home mortgages, create "pass-through" vehicles they can sell in bond-like markets, and thereby mobilize that sector of debt. Large, efficient bond markets permit the acquisition or unloading of 30-year obligations in a matter of minutes. Bond and money funds buy 6-month to 30-year obligations with money that can be called away in an instant by a fund holder's check. Government agencies borrow to make a market in vehicles like farm mortgages that might not otherwise trade on their own. Or the government guarantees loans that might otherwise be refused by creditors.
All of these devices, and more, convert debt to short-term instruments that can be instantly switched into cash or demand deposits—perfect examples of Friedman's money substitutes. In fact, today's debt instruments are frequently traded directly for goods. Set up a commodity account with a T-Bill. Trade a second mortgage for a house. Find out just how much of a money supply you can mobilize. You'll be amazed.
As debt became money, velocities increased dramatically (Friedman said they would). And that's why demand-deposit turnover has gone through the roof: nobody leaves idle funds in checking accounts or cash any more. They exchange them for interest-bearing debt, instead.
UP, UP, AND AWAY
Furthermore, our borrowing and therefore our debt/money supply have expanded without hesitation over the last 30 years, and they've done it faster than the supply of goods moving to market. That's why the Consumer Price Index has expanded through recessions as well as booms, through periods of constant M1 as well as accelerating M1 growth. And that's what revalidates our quantity theory of money. Some graphs will help to illustrate these points (see pages 40-41).
Reason
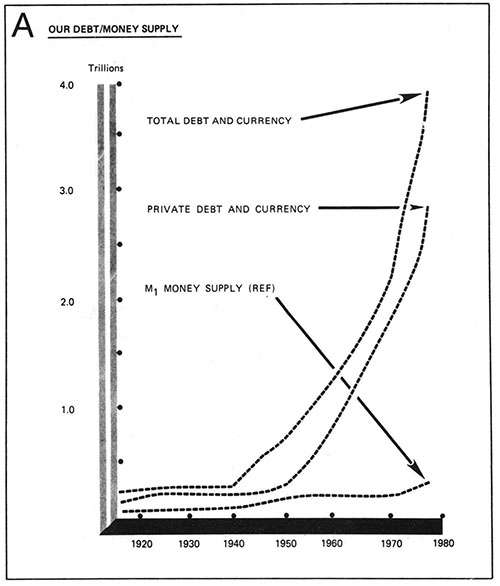
Graph A shows the growth of all nonfinancial debt/money in the United States. The two major sectors are private debt, 71 percent of total, and government debt, 27 percent of total. The remaining 2 percent is currency and coin.
The M1 money supply is shown for reference. Financial debt is omitted since financial intermediaries merely convert debt; they don't create it. For example, banks convert deposits into nonfinancial business loans. To prevent double counting, then, the financial debt must be left out.
Notice that our debt/money supply has increased geometrically since 1940. Debt that totaled less than $200 billion that year mushroomed into obligations of nearly $4 trillion by 1977. Also, notice that M1—that "converted" debt/money most available to the banking system and therefore most amenable to manipulation by the Federal Reserve System—has not kept pace. By 1977 it dwindled to less than 9 percent of the total.
There's another form of debt that has intriguing implications for our future, but I've omitted it here. I'm referring to unfunded forward obligations such as Social Security, government pensions, and private retirement programs. This would add another $7,392 billion in obligations to our graph for 1977, bringing the total to an astounding average of $50,000 in obligations per person in the United States. The effect of unfunded obligations on the creation and disposition of "hard" debt is poorly defined, however. Besides, the nation seems to be preparing to default on those obligations, so they may not affect us even in the future.
CREDIT CRISIS
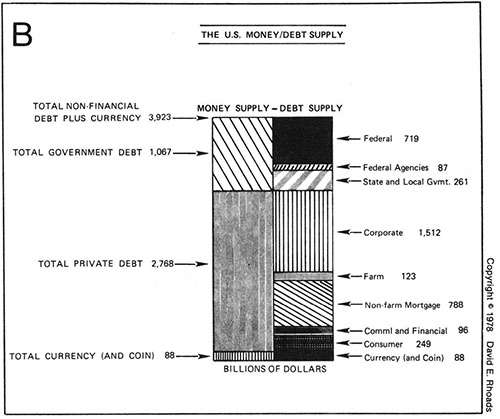
Graph B recaps the major components of our debt/money supply at the end of 1977. You'll notice that this graph really highlights the debt aspect of our money supply. It makes immediately apparent the fact that the stability of our money supply depends directly upon the creditworthiness of those who take on debt. If a borrower can't service a debt, his whole portion of debt/money may dissolve in bankruptcy. If a lot of borrowers suddenly can't service their debts, a major portion of debt/money disappears, and the event is called a credit crisis.
Reason
It's also apparent that the future growth of our money supply is limited by our borrowing capacity—or our willingless to indulge in funny-money schemes, such as food stamps and inflation of currency and bank money supplies. In short, if we don't monetize both public and private debt, there's a real limit to how much debt/money we can generate.
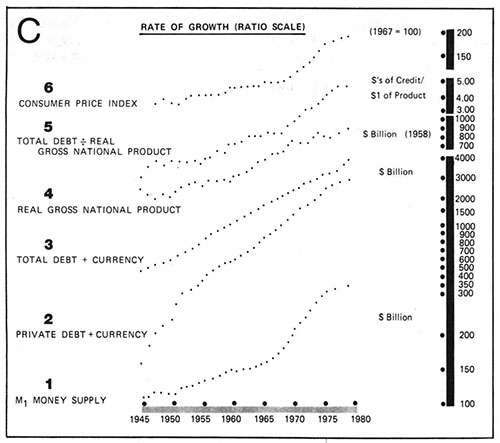
Some consequences of today's exploding debt curve are shown in Graph C. The typical money-supply measure, M1, is shown at the bottom (Curve 1). Private debt + currency and total debt + currency (Curves 2 and 3) show how our main money substitutes have grown since World War II. (The difference between the two is government debt.) Notice that total debt has expanded at a rate substantially higher than that of M1. This means that the economy is generating money faster than the banking system.
Reason
ON TO RECOVERY
Prior to World War II, the expansion process would end periodically. The ratio of debt/money to real production seemed to center on the one-to-one level, with the market carrying about a dollar of debt or currency for every dollar of real product generated each year. Times of speculation produced higher rates and higher prices (1920-21 ran to $1.10), while times of adjustment produced lower rates and lower prices (1939-42 ran under $.90). But, excesses in either direction seemed to correct themselves. (One exception to this was 1930-33, when production collapsed at a much faster rate than the debt/money supply; however, that incident was precipitated by the Federal Reserve's catastrophic mishandling of a credit crunch and should be considered an anomaly.)
The excessive-expansion syndrome used to be corrected by massive destruction of debts. The process was almost automatic once it got under way. At some point in an expansion, creditors would begin to doubt the strength of the debts they held. Some would begin to sell their holdings for cash (their "liquidity preference would shoot up," to use one of Arthur Burns's favorite euphemisms). In time, others would notice and would decide to cash in too. The resulting demand for cash would greatly outstrip supply, and for those still holding debt, the run was on. In the process, prices would collapse.
Lack of cash to convert debt induced bankruptcies and failures. Banks broke right along with everything else. And debt was destroyed apace. But the credit collapse would quickly run out of shaky debt to destroy, the credit implosion would end, and recovery would begin.
As you can imagine, this destruction of debt was traumatic for creditors and bankers. It was because of their trauma, in fact, that the Federal Reserve System was established in 1913. And after a few false starts (notably the depressions of 1920-21, 1923-24, 1926-27, 1929-33, and 1937-38), it finally got its act together, learned to provide unlimited reserves in a credit crisis, and has ever since successfully nipped them in the bud.
Now look at Curve 4, real gross national product. This, a measure of the quantity of products created in the economy each year, is growing at a slower rate than the total of debt/money. (Debt/money is increasing faster than the supply of goods.) Curve 5, the ratio of total debt to real gross national product, compares the two. It shows how an increasing number of debt/money dollars have been chasing each dollar of real goods since World War II. According to the quantity theory of money, we should expect this to drive up the price of goods, and indeed it has. Curve 6, consumer price index, parallels the comparison of debt to real product almost perfectly.
Reason
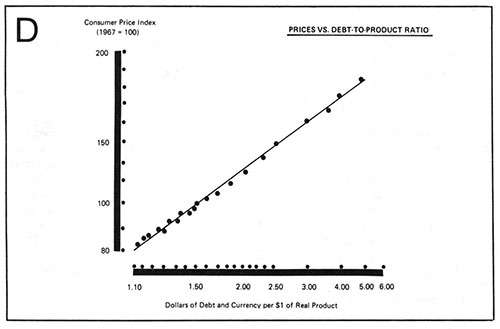
This relationship stands out starkly in Graph D, prices vs. debt/money-to-product ratio. Here the annual excess in the number of dollars of debt and currency over each dollar of real goods produced is compared to the index of consumer prices. The resulting pattern indicates a strong correlation. Not only that, but the correlation line is at a 45-degree angle between the two variables. This means that a creation of more debt/money than real production drives surplus dollars right into price increases. This, then, is what's powering today's price inflation—excessive growth in our debt/money supply.
The process even feeds on itself. As prices climb, people develop more equity in their properties to borrow against. Their "loan-ability" increases. Many succumb to temptation and borrow to raise their consumption levels, to "invest" in other properties, or to speculate with, thereby driving prices even higher. Conversely, those who don't speculate or "invest" usually end up having to borrow against their appreciating equities anyway, just to cover an expanding gap between prices and income. This validates the rise in prices. And the process rolls on a while longer.
PUSHING CREDIT
As luck would have it, the Fed has not had to go it alone in the crunch-avoidance process. Government has helped. Whenever a substantial borrower has shown signs of impending default, Washington has swooped in with direct aid (farmers) or guarantees (Lockheed).
In fact, government now steps in whenever the debt/money generator merely looks as if it's slowing down. Federal agencies borrow at special rates and relend to people who might not otherwise qualify for credit. Loan guarantees induce creditors to loan more to marginal borrowers. Outlawing of "redlining," "sexist" credit discrimination, and other credit practices insures continued or new sources of debtors.
Or if it looks as if nothing else will keep the generator going, government steps up its own borrowing and spending and subsidizes that of other debtors. Direct subsidy of house payments, doctor bills, and food purchases keeps debtors—and thereby the whole money and credit system—afloat. Indirect subsidies such as the granting of tax deductions for interest payments and taxes on real estate add new glow to dying credit areas and keep the speculating and borrowing going.
But most important of all, the old barrier to the creation of money—the gold-backing requirement—has been removed. Now there's no limit to the creation of cash and reserves in case of a credit crisis and a run. Now the sky's the limit for creating debt/money.
All this government intervention—through the Fed; through credit supports, payment guarantees, and subsidies; or through removal of barriers to the creation of debt/money—has kept the debt/money supply expanding. In this way, our government has effectively kept the inflation fire going. And that proves our second economic proposition, that government mishandling of the economy is the root cause of today's inflation.
DEBT MOUNTAIN
The upshot of all this is that we've created the biggest debt/money mountain in history. That's what the curve in Graph A is—a mountain of debt. And it's fast becoming unsustainable.
By the end of 1977, we achieved $4.49 of debt/money per $1.00 of real production—the highest rate in history. We got there by sucking into our debt/money whirlpool the world's most marginal borrowers. Then we loaded them with even more credit.
Now, today's debtors have reached their absolute borrowing limits. That's what the money and credit problems around the world mean: our mountain of loans is turning sour. It's being transformed into a pile of pending adjustments—failures, defaults, and bankruptcies.
The mountain is an avalanche in waiting. If it ever lets go, the economy might even snap back to its old level of a one-to-one ratio between debt/money and real production. This would mean a collapse of 75 percent of the nation's debt and credit. Of course, prices would fall that amount too—but we tend not to think about that so much when we're going down the credit tubes.
Our situation has not gone unnoticed by the Fed. In fact, since the late '60s it's been trying to defuse the credit-collapse potential of our debt/money supply. By steadfastly refusing to provide all the cash and demand deposits the economy wanted, it's kept the credit-expansion process from rolling on at the rate that it wanted.
That's why M1 growth has not matched the expansion of debt or prices in recent years. And that's how we have achieved the highest bankruptcy level in history during a historic inflation—a unique achievement. (Liabilities of companies that failed reached $4.5 billion in 1975—the highest ever—and they've held near there ever since.) In essence, the Fed's trying to pull off a slow-motion crash, to let a few rocks go while it holds the bulk of the avalanche in check.
Unfortunately, they're not making much real headway against "Debt Mountain." Whenever they get the process rolling toward a really good debt-destruction derby, they lose their nerve and pull back. Not only that, but government gets scared early and begins pulling out all its debt encouragement stops. So while the Fed's trying to let loose a few boulders at the bottom of the pile, government—by increasing its borrowing, spending, and encouragement of more debt—adds more boulders at the top of the pile. And the mountain grows and grows and grows.
This leads to wild swings between incipient collapse and incipient hyperinflation—to a spastic economy. Each spasm catches a lot of people and companies in the wrong investment posture, and they join the bankruptcy statistics. Also, each swing carries with it the potential for being the last spasm. Each swing just might be the one that will go too far, the one that will split the very fabric of our economy, wiping it out once and for all.
Likewise, so long as we don't have a terminal swing, none of the oscillations will run its course, none will be permitted to flush out the economic system, so they'll keep on coming around.
IMPENDING DISASTER
When will all this end? Not a soul alive knows the answer to that. There's not even anyone who can tell which oscillation—either inflation or credit collapse—will finally do the dirty deed and end our game. That's why we have so many, varied, and extreme economic forecasts today.
But I suspect that the final resolution is not far away. Our debt structure is exceedingly tired, and we're running out of options with which to keep the game going. Over the last generation we've pulled about all the tricks we could devise to maintain credit expansion. Just about everyone who can, has borrowed. And public feeling against further government credit inducements, loan guarantees, and subsidies is mounting daily, so it seems like we're very close to our absolute borrowing limit.
At the same time, we've run out of slack in the bank/money machine. Our economy is so tight now that it will immediately convert any excess cash or demand deposits into a self-sustaining speculative boom. And that would mean even greater price increases, with still more debt and all that that entails.
This, then, is where a lifetime of good intentions has led us: to a minefield of potential disasters. We can't stand still, but the further we go, the less margin for error we have left. By solving only one side of the old credit-cycle problem (the credit-collapse side), we've let the other side (the credit-expansion side) run until it threatens to destroy us.
What will happen, of course, is that someone will make a fatal error. On one of the economic oscillations, somebody will zig when they should have zagged, and our economy will come apart like a cut golf ball.
DISASTER PROTECTION
You might think about taking some precautions in your business and personal investing. Start with the ancient and honorable technique of getting liquid. Convert your assets into stocks, bonds, or commodities that can be exchanged quickly should the market suddenly let go.
Then diversify. That way, if a crisis rotates through one of your investment areas without warning, you won't lose everything. This means you should hold some cash as well as gold coins, some stock as well as some T-Bills, a domestic savings account as well as a foreign annuity, etc. Just be sure not to diversify into another illiquid area. Stay in investment vehicles whose prices can be checked in the newspaper each day (or at the broker's office), things that can be sold at a moment's notice if need be.
Watch demand deposit turnover statistics in the Federal Reserve Bulletin. They've been climbing almost vertically for several years now. They tip off the viability of money substitutes. When they break and head south, the funny-money game will be over. It will be time to head into real cash.
Watch the monetary aggregates for sudden change. They have been trending, especially the monetary base, for years now. A sudden change upward would indicate increased inflation of the money supply. Level or downward breaks would indicate potential deflation.
Watch short-term interest rates. A blow-off (upward spike) might verify a credit crisis. Conversely, a precipitous drop would accompany a forced-draft expansion of currency and demand deposits. Or it would verify a credit collapse. (Look to monetary aggregates to determine which.)
Watch prices for goods and services. If they race too far ahead of the money supply, they'll precipitate a recession and a potential credit crisis.
Above all, be nice to your boss. This is definitely not the time to have to go looking for a new job.
David Rhoads is a writer and an investment advisor and consultant with a background in business economics. He is the author of How to Survive a Spastic Economy.
This article originally appeared in print under the headline "Money Really Matters."