Time for Stocks
If you missed the 1975-1976 bull market, another opportunity is coming up.
Several years ago, Japanese soldiers were discovered in the jungle on several South Pacific islands. They were soldiers from the Second World War who had survived alone for 30 years. Most of them didn't know the war was over. It is doubtful that they are today able to function effectively in their homeland.
What does this have to do with investing? Many of today's investors, preocuppied with protecting themselves against short-term price inflation, are much like those soldiers—ill-equipped for current opportunities. And opportuniites there are. Sometime between mid-1978 and the first quarter of 1979, common stocks will be at low valuation levels, historically and relative to alternative investments. Regardless of what one thinks about stock values, there should also be room for maneuver purely on a cyclical basis. It is important to take advantage of cyclical capital-gain opportunities to fight inflation. Anyone who missed the 1975-76 bull market has another chance coming up.
Granted, there will still be plenty of long-term negatives to worry about. But investors who stay away from the most government-infested areas stand a reasonable chance to do even better than the averages on their cyclical recovery.
Those who emphasize buying and holding "commodities," "collectibles," or the like as a defense against inflation often forget that timing is crucial to their success. Most "things" simply depreciate in value over time. During periods of stability, they tend to just sit there and corrode. The more useful and durable items (gold, gems) may fluctuate (widely) around the trend rate of price inflation, but the current trend rate doesn't foreshadow a huge increase in the price of gold relative to other commodities and the dollar. The elements that produced gold's spectacular 1970-74 bull market are not all present this time.
For long-term investments, things which are likely to do no better than price inflation are just not adequate. Far better to go with value-adding business entities that figure out how to boost productivity and cut real prices over time. This is especially true in times of relative stability. It is very likely that we are entering one of those times—say for the next five years or so. There will probably be more inflation in 1978, but no new records exceeding 1973-74. The next important threat could well be a deflation in the mid-1980's. Until then, investors are getting a chance to do some catching up for the lost purchasing power of the past decade.
Investors are warned off taking advantage of periodic opportunities, however, with a doomsday litany that is now well known: the welfare state is expanding. Its spending accounts for 35-50 percent of the economic activity in the United States. Taxes are rising for the productive and falling for the idle. Government regulation narrows property rights. With the visible tax-bite high, extra government funds are generated by inflating the money supply. The new money gets spent first where the government wants it to be spent. The losers are those who must play catch-up. Meanwhile, the tax laws, plus inflation, encourage the use of debt in capital structures and in personal finances, increasing financial risks. The business climate becomes progressively hostile, rates of return decline, capital flees, and stock prices fall. Eventually people start discounting faster than the government can print money; somebody yells, "Whoa!" and the leveraged financial structure collapses into an economic depression.
Most of the litany is true. Also true is that primary-trend cycles often stretch beyond individuals' investment lifetimes. But there are some long interludes in the development of these cycles. Even the United Kingdom has some exciting bull markets (up 96 percent from late 1976 to late 1977, 162 percent from the end of '74 to mid-1976). The here-and-now is often nicer than the "long term," so we'd best learn to use it.
Psychological tests show that the longer a person has been looking at a picture, the more that picture can be changed without that person perceiving the change. Those who respect free markets have been right for quite awhile in their assessment of where the US government's actions would take the economy and the country over the long term. As well as these perceptual sets have served, however, they may blind the holder to periodic opportunities—like one-to-three-year major uptrends in stock prices. These perceptual sets have also been held so long that when a primary (decade-long) trend change develops, they may be very difficult to break.
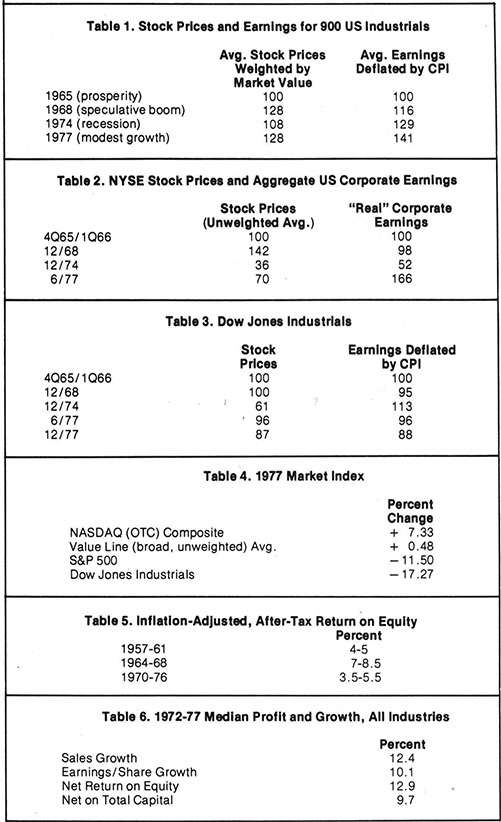
A Value Line composite earnings and stock-price computation for 90 major US industrial companies, when indexed, and after the earnings are deflated by the Consumer Price Index, produces the interesting 1965-77 overview shown in Table 1. (Numbers for '77 were estimated in 12/77.) More difficult adjustments are needed to produce "real" earnings, by accounting for inventory profits and under-depreciation of assets and then adding back gains on monetary liabilities. Indicator Digest recently ran a chart of US corporate profits with such additional adjustments reportedly made to an aggregate US corporate-earnings figure. Indexed again, and compared to an unweighted average of common stocks on the New York Stock Exchange, the results for the past years are displayed in Table 2.
From both sets of figures, even allowing for the very approximate quality of the earnings numbers in the second, the same set of relationships emerges: assumed equilibrium in 1965, overvaluation in 1968, undervaluation in 1974, and continued undervaluation in 1977—despite the market having been in a major uptrend from late 1974 through mid-1977.
Table 3 shows the Dow Jones Industrial Average with its earnings deflated by the CPI and indexed for comparison. Again, even allowing for flexibility in the earnings figures, the story is interesting. The old basic industry cyclicals that make up the DJIA don't show the current "undervaluation" suggested by the broader samplings. This may explain the market index results for 1977—a year of divergences in the market—shown in Table 4.
From the end of 1965 through the end of 1977, the Consumer Price Index rose by about 94 percent. Dividends of major US companies rose about 86 percent. Nice try, but no cigar.
After-tax returns on equity, with a full range of inflation adjustments by Prof. Burton Malkiel, of Princeton, are set out in Table 5. Current returns are running above 5 percent. Perhaps returns are eroding; or perhaps they are merely returning to a more "normal" level.
One thing is relatively clear from other data. The liquidity of US industrial companies has declined since the mid-1950's. Cash as a percentage of current liabilities has fallen from above 50 percent to less than 20 percent. Debt as a percentage of total capital has increased. As a result of the increased financial risks, one might reasonably demand a higher than normal return.
The last five years saw both severe economic and inflation trouble and a relatively good recovery. For the period, a Forbes 997-stock study showed the median stock price down 10 percent and only 39 percent of stocks up in price, with only 18 percent rising in price more than the CPI (up 45 percent). Table 6 shows the median annual profit and growth figures for all industries for the period. No adjustments for inflation have been made, and these are late 1977 numbers. (For the net return on equity, note the marked variance from Malkiel's adjusted figures in Table 5.) The current median debt/equity ratio was 0.4 (that is, for every dollar of equity there was 40 cents of debt). The median net income per dollar of sales (profit margin) was 4.7 cents.
There are three things to remember about price inflation and stock quotations: Expectations of flat or declining rates of inflation are associated with rising stock prices; expectations of increasing inflation are linked to declining stock prices; and when inflation goes up (down), price/earnings (P/E) ratios decline (rise). The switch from unexpected to expected inflation in the 1973-74 period had much to do with the severity of the worldwide decline in the markets.
The P/E ratio for a 500-stock index of the London Stock Market was in the 15-to-19 range from mid-1971 to mid-1973 while UK stock prices peaked. In 1977, that stock-price index was back to mid-1972 levels, but the P/E languished around 9. For the 1971-73 period, UK consumer prices rose at an annual rate of 7-9 percent. For the second quarter of 1977 the annualized increase was 16.5 percent.
While the absolute level of inflation has consequences for the market's overall P/E ratio, it doesn't have any bearing on whether or not a bull market in stock prices will develop. All that is required is a stabilizing of the inflation rate. The market can deal with stability—it discounts the inflation and gets on with its business. It was a sharp slowing in the rate of inflation that set off the 96 percent gain in UK share prices from late 1976 to late 1977.
How does all this translate into investment decisions? It is helpful for most investors to simplify as much as possible. That boils down to the following investment media for the following price environments:
Accelerating inflation: gold
Decelerating inflation: stocks
Stability: stocks
Decelerating deflation: stocks
Accelerating deflation: cash
It is the nature of all markets that they fluctuate—to extremes. There is elasticity in almost everything: from capitalization ratios, capacity utilization, labor productivity, and profit margins, to government deficits, monetary growth rates, bank liquidity, and investor expectations. Stock prices fluctuate around a somewhat less volatile progression of the real earnings from the production of goods and services. Can we determine, however, when stock prices show over- or undervaluation?
It is, of course, usually difficult to say what "intrinsic value" is in absolute terms. As good a measure as you're likely to find is the income being derived from an investment—in a company, land, apartment buildings, or what have you. Some people say, "Baloney! There are no intrinsic values!" But show them General Motors yielding 33 percent per annum, and some "intrinsic value" would probably come into focus rather quickly. The cost is out in three years (six years, after-tax), and the remaining earning power and liquidation value, if any, are all gravy. That is intrinsic value. The problem is more likely to be that one's own estimation of intrinsic value may not square with that of the majority of other market participants. And that produces upset tummies.
It pays to look around and check competitive "intrinsic values." Try the same exercise with silver coins, apartment buildings, gold bullion, antique furniture, stamps, and so forth. There's a good case to be made, in terms of intrinsic values—as well as on cyclical, psychological, and monetary bases—that stock prices will soon be flirting with investment-appealing levels while "things," real property, and "collectibles" are nearing or past the top of an upswing—where the "greater fool" (or "next Arab") theory is required to support existing quotations.
BULLISH ON STOCKS
In addition to these factors, it also should be kept in mind that common-stock ownership, compared to owning commodities or collectibles, is a horse of a different color. Equity ownership in a business enterprise gives the investor a share in a process of adding value. There is the possibility for technical or managerially induced efficiences and reduction in the cost of the "real product" produced by the business. The investor seeks real gains from the enterprise's endeavors. That may be possible. It isn't for the owner of collectibles, commodities, and the like, who have no value-added process going on that may eventually bail them out of an ill-timed investment. Stock ownership offers a chance to capture some of those surplus dollars being pumped into the economy; fixed income investments do not.
As opposed to outright commodity, collectible, or most real estate ownership, the stock market also offers the following advantages:
• Limited liability (in contrast to partnership arrangements)
• Relatively low transaction costs (3 percent for typical common-stock transactions—versus about 8 percent in real estate, perhaps 10 percent or so in gold, up to an extreme of 30-50 percent in collectibles such as stamps)
• Disclosure of a relatively large quantity of market and enterprise data (ever tried to find out what those Paul Painter watercolors are actually worth right now?)
• Relatively good liquidity (ever tried to peddle raw land at a price near the last transaction in a falling market?)
• Diversification (even within a conglomerate, one can get a wide exposure to different economic sectors, both in lines of business and geography)
• Relatively less forgery and fraud trouble
• Somewhat more manageable risk factors (for example the volatility of AT&T and its total return are considerably more stable and predictable than that of a bar of gold or a French Impressionist painting—although volatility, if desired, can be found in stocks).
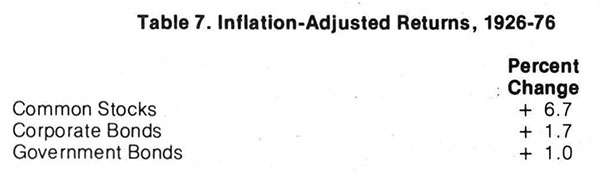
For those who like the really longterm view, how about 1897-1975? Dow Jones Industrials, up 1,979 percent; cost of living, up 565 percent. The long-term trend is fairly steady in favor of common stocks, despite a few nasty 10-year periods. That doesn't include dividends. For 1926-76, Ibbotson-Sinquefield data show inflation-adjusted "real" returns over the long pull. Fixed income securities generally don't come close to competing with common-stock dividend income over the long pull. Dividends grow; bond interest doesn't.
Of course, during major uptrends in stock prices (one-three years), stocks invariably outpace inflation by a large amount. Even just the middle third of major uptrends is usually enough to do the job. Good growth companies, purchased at the right time in terms of the primary trend in stock prices (10 years and up) and merely held for the long term, can work out very well vis-a-vis inflation. So investors may well get good long-term "position" with purchases around the upcoming major-trend low.
CURRENT MAJOR DOWNTREND
At year-end 1977, unweighted market averages were still close to their mid-1977 highs. The Dow Industrials had wilted 17 percent from year-earlier levels, to 829, and they continued to limp downward in 1978. The broad general market totally lost its upward momentum. The picture in the first quarter of '78 is this: The market is vulnerable. Margin debt is at a record high. Odd-lotters are not pessimistic. NYSE members are relatively bearish. Institutions, talking cautiously, have been acting confidently. Bank and corporate liquidity is diminishing again. The economic expansion has aged although that goes unnoticed in some quarters: federal deficits are at a staggering $60 billion level and likely to expand, a stimulus far too great for an economy late in a cyclical expansion—someone always forgets the deflationary part of the Keynesian prescription. Monetary aggregates are expanding above trend at an alarming rate. Not surprisingly, price inflation is accelerating; interest rates are rising; bond prices are collapsing; the dollar is declining; and foreign investors are avoiding US stocks like the plague. And all of this explains why stock prices are turning south and likely to go further than generally expected.
So far in this expansion there haven't been as many distortions as accompanied the last expansion, suggesting that the cyclical contraction in the economy may be somewhat milder this time. Memories of last time's panic persist, though, and have a restraining influence on business decisions.
At the late 1974 lows, the DJIA's P/E ratio was 5.8; its dividend yield, 6.6 percent. Historically, these are attractive levels. The earnings yield was 17 percent. For the S&P 500, the P/E higher and the yield lower. Yields on the DJIA in the neighborhood of 7 percent seem likely before the current major downtrend ends. On estimated dividends of $46-$48 for '78, that gives a reasonable range of 657 to 686 for a low. That assumes the mild economic contraction scenario—with most of the bearish force coming from inflationary expectations reflected in interest rates and fearful memories of "last time." On the same assumptions, DJIA earnings of $94 seem reasonable. A low P/E of 6.5 to 7.0 would give about a 6.30 to 660 low for the DJIA in '78. That would be a high earnings yield for the year of 14-15 percent. This would not be out of line with the expected 9 percent peak average yields on Corporate Aaa bonds. With Aaa yields at 9¼ percent in '74, the DJIA P/E dipped under 6 at year-end. There shouldn't be as much panic this time.
Various market cycles and trend rates in stock prices suggest a major-trend low sometime in the second half of 1978—in the 600's for the DJIA. When most of the bearish factors noted above have begun to swing the other way, it should be possible to call a major-trend reversal to the upside with more specificity. In the meantime, the investor should wait with cash, perhaps some gold, and a few puts for the speculator. Bear markets are wonderful. They are one of the few times that the value of the dollar increases.
Let's assume that the DJIA does go below 700 in 1978. What will stock values look like? A good deal better than eight years earlier. The DJIA first reached the 600's in the early 1960's. It hit this area in 1970 and again in 1974. The general market, as measured by an unweighted averge of the NYSE, should be below 1964 levels. For the market as a whole, the buildup of values has probably exceeded that for the DJIA (see Tables 1, 2, and 3). If the stock market decline exceeds the contraction in corporate-earnings growth, values will increase even more.
Yields in excess of 6.5 percent on the Dow Industrials historically have marked a relatively undervalued market. On the assumptions set out above, the DJIA below 700 would be "undervalued" on this basis. DJIA earnings yield would be around 14-15 percent, which should handily exceed the competing high-grade government and corporate bond yields. And that takes no account of any earnings growth that may occur. Here, it should be noted that the quality of reported earnings is getting better. Research shows that inflation-adjusted (replacement costs) earnings are rising as a percentage of nominal reported earnings after a decade of decline (1966-76).
A little further out, the cyclical picture looks very bright. By early 1980, five out of seven selected, identifiable market cycles of four years or more should be headed up. That is a stronger cyclical outlook than has existed at any time since the early 1960's.
THE PRIMARY DOWNTREND
Stock prices have been in a primary downtrend since 1968—since 1965 if you only look at the old-time blue chips. Real corporate profits through 1975 had gone nowhere. Now earnings are forging ahead. Has the primary downtrend ended? Overall, probably not; but a worthwhile respite is in view.
In terms of the economy, it is rather clear that there has merely been a stall. There has been no deflation. There has been no great rebuilding of liquidity in the economy. Government has yet to get serious about curtailing its excessive deficit spending. Until it does, the economy cannot get the bulk of the distortions in it ironed out or even fully discounted. The debt burden and contingent future liabilities (pension liabilities, loan guarantees, letters of credit, etc.) are staggering. Adjustments will be required. Until such occur, long-term buy-and-hold investing isn't likely to be very rewarding.
New-high inflation rates, topping 1974's, do not seem very likely in the next few years. In free-market circles, that is probably heresy, but the shifting mood of the country supports this view. Consider the following: Businessmen remain cautious—so far, there have been no big inventory buildups or other spending sprees this time. Carter's presidency neatly captures the transition that is occurring—the dying New Deal on one side (they still dominate Congress), the emerging call for fiscal responsibility, peace, and tranquility on the other. The NAACP sides with the Wall Street Journal on the need for freeing up energy prices to better foster the economic growth their constituency now realizes it needs. The Rev. Jesse Jackson takes a new tack with his black activists in Chicago, calling for a return to discipline, the 3R's, hard work, and parental involvement in the ghetto schools. After years of disdain, college students are returning to business curricula in increasing numbers. Everyone is worried about inflation. The ascendency of the monetarist school of economics has raised the professional consciousness to the fact that money matters—inflating the supply has nasty consequences. Public confidence polls show all sorts of institutions being held in remarkable all-time low esteem after a long slide since 1972 (healthy attitudes that may prompt some positive changes). And finally, statist US Rep. Abner Mikva on tax reform (that is, income reallocation): "There's zero enthusiasm for tax reform among the people."
Caution prevails, skepticism abounds, the people want stability, and the message is seeping into Washington, DC.
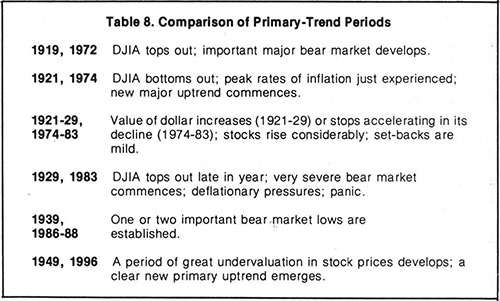
So, from early 1978, here's some long-term projections: Inflation rates will rise during 1978, but not to new-high levels. The major downtrend in stock prices will likely reach the mid-600's in the DJIA. The decline will be badly overdone for most of the market. The depth of the undervaluation will be due in large part to the erroneous expectation that the economy is lapsing into another 1974 crunch period with new high inflation rates. The major downtrend should end sometime in the second half of 1978, perhaps as late as the first quarter of 1979. The ensuing major uptrend will probably be exceptionally strong. The one projected major bear market between 1978 and 1984 will most likely be relatively mild. The guess is that inflation rates will be relatively stable but troublesomely high during this period. Then, for 1983 or 1984, market cycle work (rough approximations), comparisons to past market history (a statistically insignificant sample), and guesses about political and social trends (very imprecise) all suggest that a severe economic squeeze will develop, very possibly featuring strong deflationary pressure. Stocks should be well overextended on the upside by then. The market's decline to lows around 1987 should be very severe. Assuming the marketplace survives all this, a very weak forecast would suggest the rebuilding process could establish another period of great undervaluation and despair, with a launching point for a new primary uptrend around 1996. Consider Table 8, with its perhaps too-facile comparison of the projected current primary-trend period with the last one.
View all the long-term forecasts with some skepticism. But while the millenium probably has not arrived, there nevertheless appears to be an excellent opportunity brewing right now in the US equity markets. No other major country's economy or market looks as promising. When the time comes for holding shares of industrial enterprises, it would be a sorry commentary on their theory's relationship to the real world if free-market believers were still off in the woods gathering nuts and berries.
The time to start doing your research and drawing up your shopping list is right now, during the bear market—not after the turn has come. If you need help on timing, stock selection, or overall financial planning, go out and look for that help right now, too. After the rush to buy begins, it is a little late. Everybody is a hero in a bull market. You want to know what potential advisors had clients doing from mid-1977 through the end of the current major bear market.
Mr. Clucas is a lawyer who regularly writes on the US and Japanese economic situations. His investment experience dates from 1963; his investment advisory work, from 1974.
This article originally appeared in print under the headline "Time for Stocks."


