Money: How I Made $5 Million Speculating in Radish Futures
Many years ago, before greed overcame my natural good taste, I would have been ashamed to be seen in possession of a book with a title like HOW I TURNED $2.50 INTO $5 MILLION SPECULATING ON RADISH FUTURES.
I would purchase such books by mail, anonymously, and only on the publisher's assurance that they would be delivered in a plain brown wrapper. And then, after I had read them, I would always hate myself and suspect that the author was not in fact supporting himself by arbitraging radishes, but rather by selling worthless books to gullibles like myself.
A wise old capitalist once told me that the secret of successful investing was not to lose your money. A corollary of this sound rule would undoubtedly be not to waste your money on get-rich-quick books.
A book of just such suspect title is THE DOW THEORY CAN MAKE YOU RICH, By Robert Barnes (Arlington House, $9.95, copyright 1973). Seldom has a copyright been more secure.
I do not know how many ways there are to obtain sub-par results in the stock market, but Mr. Barnes certainly adds a few more to the list. Even an uncritical acceptance of the author's own figures reveals that his trading strategies will in fact not make you rich.
Barnes' research is grounded in technical rather than fundamental analysis. Virtually the entire text is confined to describing how he constructed his quantified trading strategies, how they are implemented, and what their results were over given test periods. His "History" of the Dow Theory is confined to one page. His coverage of the criticisms of the Dow Theory is primarily taken from another writer's footnoted work, but fails to mention two of the most important criticisms: (1) that the Theory's signals are very often too late, and (2) that the Theory provides virtually no help for the intermediate-trend trader (i.e., trades geared to less than one year's duration).
Nor is any mention made of the longterm upward bias built into the Dow Jones Industrial Averages by reason of the way stock splits affect the divisor.
One criticism noted is that the Dow Jones Industrial Averages (DJIA) may not be representative enough of general market trends to serve as a useful guide. The assertion that it is representative enough is viewed by Barnes as "not too convincing." The author thus ignores research indicating that the correlation coefficients between the DJIA and the other popular market indexes all exceed .90 over an extended period of time. While it is true that relative levels in the popular averages may deviate substantially from unweighted geometric averages, there is still a high degree of correlation between significant trend reversals in all the indexes and the unweighted averages.
BUYING THE AVERAGES
Another criticism of the Dow Theory is that "you can't buy the Averages." The author states that all but the small investors can indeed "buy the DJIA." He is correct up to a point, neglecting the fact that by purchasing an efficiently diversified no-load mutual fund, the small investor too can come very close to "buying the Averages." So too, research by Fisher and Lorie suggests that 90% of all feasible reduction in the variability of the rate of return for the New York Stock Exchange as a whole can be achieved with the purchase of 16 randomly selected NYSE stocks.
In Chapter 1, Barnes indicates that the Dow Theory is based on the assumption that there are trends in the market. Mr. Barnes makes no reference to the "random walk" and "efficient market" research which has recently mounted a strong challenge to the notion that there is any statistically significant dependent relationship between successive price changes. In other words, does what has happened in the past have any value in forecasting future price movements? Or is Dow Theory like numerology, based on explanations ex post? (See, e.g., "What the Hell is a Random Walk?" in Adam Smith's THE MONEY GAME.) Barnes does at least hint that there seem to be a variety of conclusions which Dow theorists can draw from the same data.
Having more or less spoken to the theory, the author then constructs, in painstaking detail, what he calls "six popular strategies." These are, briefly: (1) A quantification of the Dow Theory—loosely based on Robert Rhea's workcalling a reversal into a bear market when lower tops and bottoms at relevant measuring points appear in both the Industrial and Transportation Averages. (2) A trendline strategy in which violation by both Averages of the trendlines connecting their respective secondary lows in a bull market results in calling a new bear market. (3) A 12-month moving average for each Average which, when both have been penetrated, signals a new primary trend. (4) A "contrary opinion" strategy based on extraordinarily sharp price moves in one direction dictating a position contrary to that trend. (5) A secondary reaction strategy, based on the assumption that a primary trend is finished when a secondary reaction against that primary trend is of a magnitude in excess of 90% of all preceding secondary reactions. (6) A simple buy-and-hold strategy.
Unfortunately, for all the artfulness which went into constructing these strategies, the test results which Barnes reports suggest that better results would have been obtained by ignoring the charts and simply buying and holding the Dow stocks. As Barnes frankly reports, his Dow Theory-based strategies were generally quite bad. Some long runs of losses could have been a real longer-term disaster, depending on what starting date was used.
SUGGESTIONS THAT WORK
Does the author have any suggestions that do work? The reader struggles on, for to quit here would be to admit he has wasted $9.95.
Barnes begins his final exposition with the plausible assumption that stocks with high relative volatility may give a trader a better chance to capture profits than does a general market average such as the DJIA. He simplifies his general market strategies for use on single stocks. Then he goes to a popular chart service book, extracts the first twenty stocks listed there, and discovers which five had the largest up and down moves relative to the rest of them from 1944 through 1959. (In a crude fashion he sought the stocks with the highest beta coefficients.) He found some evidence that these volatility rankings tend to persist through time.
Armed with this incredibly small "universe" of 20 stocks and a sampling of five stocks therefrom, the author seeks to obtain generalizable conclusions about the performance of his simplified strategies on individual stocks. The methodological defects are already obvious and fatal to his stated purpose.
The author tells us that the very best results came from his "Secondary Reaction" strategy. In short, a change in trend direction of X% from one measuring point to another implies a reversal of the previous primary trend. It appears that dividends, commissions, and the crucial effects of compounding successive trade results are all cheerfully ignored. Barnes reports cumulative profits of 507% for the test period—a "portfolio" average for the five stocks of 101%, assuming that equal dollar amounts were used in each of the five stocks. This 101% result over 11.75 years compares to Barnes' statement that the DJIA rose 43% over this same time period.
When I say that Barnes fails to take account of the effect of compounding his trades I mean that he simply adds the percent gain or loss on each transaction without reference to whether the portfolio had more or less money left from prior trades. For example, if one trade showed a 40% loss and the next one a 50% gain, Barnes would add the two figures and report a 10% net gain. If you try that with real money you will find that if you've just taken a 40% loss then you've only got 60% of your original capital on which to take the subsequent 50% gain. When you calculate the results in portfolio dollars you come out, not with a 10% gain, but a 10% loss. This is one of the "adjustments" which I make in my analysis below of Barnes' results.
First, to compare results with a buy-and-hold strategy for the DJIA, it is necessary to compound the successive individual trades made in each of the five stocks. Second, we must include a roundtrip commission charge in each trade result. (I used the 2% assumption Barnes had mentioned elsewhere in the book.) Third, any paper profit or loss existent as of the end of the test period cannot be included beyond that percentage which his trading rules have "locked in," since in each case these trades were still open on that date.
Making all these adjustments, the following table shows the comparative results for the five stocks and the DJIA. Dividends are excluded in all cases, and would favor the DJIA, if included.
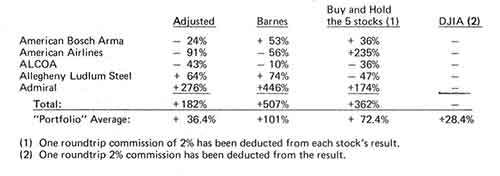
Three conclusions seem warranted: (1) Given the limited and somewhat biased sampling technique that produced the five stocks, their adjusted results are probably not, statistically, significantly better than buying and holding the DJIA stocks—and even less so if dividends were included; (2) over the test period, buying and holding the five stocks would have produced superior results to the trading strategy proposed by Barnes; and (3) by failing to account for the adjustments noted above, the author has significantly overstated his results in comparison to buying and holding either the DJIA or those five stocks.
A couple of questions: Does a 36% gain over 12 years justify taking the risk associated with component rates of return that varied from -91% to +276%? (2) What does a 5% annual return compound to over 12 years? (Hint: a lot more than 36%.)
Of course, much of the preceding analysis was only made possible by Mr. Barnes' commendable full disclosure of his data and assumptions. It suggests somewhat more honesty than is usually found in books about how to make your first million. Nevertheless, the failure to compound trading results and the omission of brokerage commissions from his "grand totals" table is not consonant with holding degrees in mathematics, as the dust jacket informs us Mr. Barnes does. Nor do the results warrant a book. An article in BARRON'S might have been more appropriate—but then copies of BARRON'S don't go for $9.95 a crack.
The reader interested in a slightly broader review of the Dow Theory (34 pages), plus a comprehensive discussion of price-volume bar charts and their use, would be better advised to obtain a copy of TECHNICAL ANALYSIS OF STOCK TRENDS by Robert D. Edwards and John Magee (John Magee, Springfield, Massachusetts; 5th ed. 1966; 474 pp.). The chart analysis described therein is about the best study produced on the subject. Price-volume bar charts are a useful tool in the technical analyst's kit. Of course, they comprise only a fraction of the input required for sophisticated work.
The reader who is merely interested in mechanical rules of thumb (similar to most of what Barnes presents in his book) may enjoy trying out a simple 12.5% filter on moves in the DJIA. Every time the DJIA closes up or down 12.5% from its last low or high closing price, respectively, a trend reversal is signalled in the direction of the 12.5% move. This "strategy" can be confined to purchases or can include short sales when long positions are closed out. It has been written about before by others. It will not make piles of money for you. But it's fun to see how it works over the long history of the Dow Averages. It would be time better spent than buying, reading, and analyzing THE DOW THEORY CAN MAKE YOU RICH.
If you really want to get rich, quickly or otherwise, a time-tested strategy is to examine how other wealthy men have amassed their fortune. Someone once asked John D. Rockefeller, Sr., how he got his. Said John D., "God gave me my money."
Davis Keeler's Money column is guest authored this month by Lloyd L. Clucas. Keeler's column alternates monthly in REASON with John J. Pierce's Science Fiction column.
This article originally appeared in print under the headline "Money: How I Made $5 Million Speculating in Radish Futures."