41 Billion Reasons Not to Sweat the Sequester: 2013 Cuts Are $44 Billion, Not $85 Billion.
Note: Taylor's website has changed since the original posting of this piece. His work is now available online here.
Economist John B. Taylor charts what sequestration will look like when it comes to federal spending levels. The short version: A lot like federal spending levels absent sequestration, which is widely reported as reducing outlays in FY2013 by about $85 billion or so.
The first thing to note is that the $85 billion figure that gets bandied about overstates this year's cuts due to sequestration by about $40 billion. According to the Congressional Budget Office (CBO) in its February 2013 report on the budget outlook, "Discretionary outlays will drop by $35 billion and mandatory spending will be reduced by $9 billion this year as a direct result of those procedures [sequestration]; additional reductions in outlays attributable to the cuts in 2013 funding will occur in later years."
You got that? When President Obama scaremongers about national parks closing and TSA lines getting longer - and when Republicans bitch and moan about the military having to set up bake sales to buy bombers - they are already misstating basic facts. The sequester will slice $44 billion off this year's budget, not $85 billion.
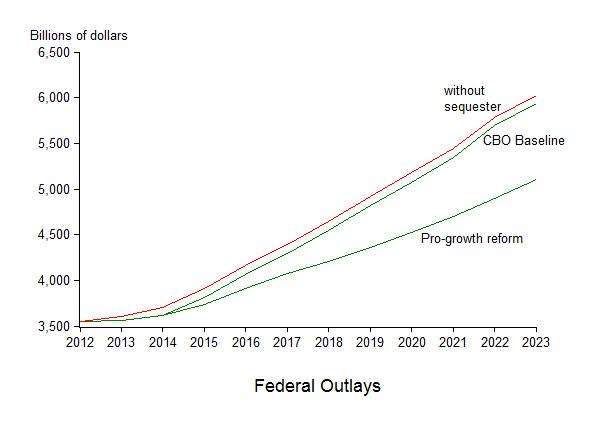
CBO figures that total spending in FY2013 will come to around $3.55 trillion (see table 1-1), or roughly the same as FY2012, when it came to $3.53 trillion. In 2014, assuming the sequester happens, CBO figures total spending will be $3.6 trillion before it jacks up considerably to $3.8 trillion in 2015 and then up to over $4 trillion in 2016. As Taylor's chart (above, right) shows, this isn't that very much different at all than what would happen absent sequestration. Taylor favors keeping the sequester but add the sensible proviso that the president and the Congress should allow all affected agencies to the flexibility "to adjust their budgets within the overall sequester totals." That blunts the criticism that the sequestration is itself too blunt an instrument.
You'll note in Taylor's chart a line marked "pro-growth reform," which is substantially lower than the the CBO baseline or spending "without sequester." Taylor explains that's the amount of spending that would happen if the government pursuied a "fiscal consolidation strategy" that reduced the debt-to-GDP ratio in a way that would return spending as a share of the economy to pre-crisis levels. In work done with John Cogan, Volker Wieland, Tobias Cwik, Taylor simulates the effects of cutting spending on the larger economy and finds that
The positive short run economic effects occur even in the model with price and wage rigidities for several reasons including that the lower spending (as a share of GDP) can reduce expected tax rates and raise permanent after-tax income compared to what would be expected under current policy. This stimulates consumption. The gradual nature of the government spending reduction, which allows time for private spending to adjust, avoids the negative aggregate demand effects that traditional Keynesian models emphasize.
How does cutting government spending spur consumption and growth? After all, if we count most government spending in GDP, significant cuts to government spending will by definition shrink the economy, right? Taylor notes the incremental but believable cuts in spending signal to businesses and consumers that massive tax hikes or truly disruptive reductions in spending are less likely to happen. As a result, economic activity proceeds. An added bonus is that misallocated resources - more likely via government spending than by private actors - get freed up as well.
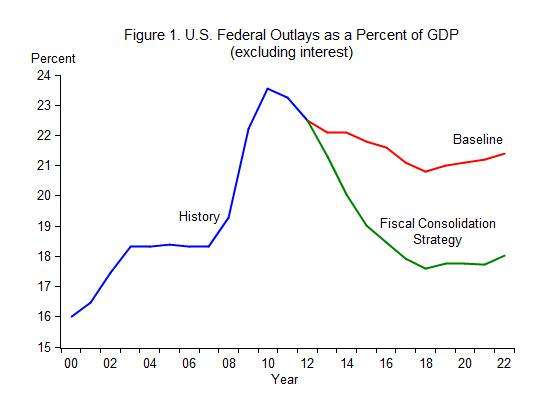
That gap on the right-hand side of the chart (Figure 1, above right) between "Baseline" and "Fiscal Consolidation Strategy" is essentially another way of marking the huge price exacted on future economic growth by high levels of government spending and debt. As Veronique de Rugy and I have noted in various articles (like this one and this one), research by Carmen Reinhart, Vincent Reinhart, and Kenneth Rogoff argues that maintaining levels of gross debt greater than 90 percent of GDP for five years at a time reduces future economic growth by as much as 1 percentage point a year for 20-plus years. We've been in such a "debt overhang" situation since 2008 and the cumulative effect over the coming years will likely be substantial. In the chart to the right, the blue line represents expected economic growth when gross debt is lower than 90 percent of GDP and the red line shows reduced growth due to debt overhang.
Who exactly is up for having 24 percent less stuff in, say, 2036? Start building it into your retirement plans, because that's where we're heading if spending and debt patterns keep going the way they're headed. As the CBO illustrates it, there's really no scenario under current trends in which revenue catches up to spending.


