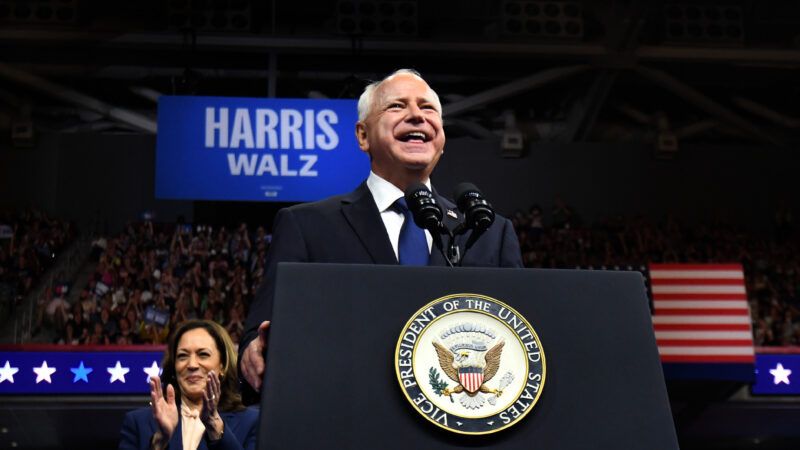
Tim Walz Loves Maps Because He Loves Central Planning
The self-described "GIS nerd" has boundless faith in the ability of maps to guide top-down government interventions.

Just a few weeks before he was tapped as Kamala Harris' running mate, Minnesota Gov. Tim Walz was at a Geographic Information Systems (GIS) industry conference where he touted the power of detailed, data-rich maps to inform policy and improve society.
"The end product of these maps is a more sustainable economy, a more sustainable environment, and lifting up of people's lives in a way that they can thrive," Walz said at the conference, per reporting from the Minnesota Reformer.
Walz's cartophilia is becoming a theme of his unveiling to the nation as Harris' veep.
A string of media reports note how the former geography teacher was an early adopter of GIS software in the classroom (where his students apparently predicted the Rwandan genocide). As governor, he's created the Minnesota Executive Map Portfolio.
His predilection for maps highlights the two features that Democrats want to stress in Walz: his affable, nerdy dad persona and his stalwart progressive credentials. It's allegedly something that people of all political persuasions should find compelling about him.
4/ Yes. Whatever their political stripes, a leader that wants to make decisions based on good data and nuance is exciting. pic.twitter.com/Vtbzj18rq0
— John Scott-Railton (@jsrailton) August 7, 2024
I'm not so sure. Advocates for minimal government who are wary of state intervention should also be very wary of an executive who puts so much faith in maps to guide policy.
This was a key insight of the late, great James C. Scott's seminal Seeing Like a State—which detailed the efforts of "high modernist" central planners, from 18th century Prussia to the Soviet Union, to transform their societies through rationalizing state intervention.
Where some people see state-created maps as merely an information-gathering tool, Scott saw an explicit effort to boil down society into more easily manipulatable blocks that could then be rearranged by government planning.
Early state-created maps "did not successfully represent the actual activity of the society they depicted nor were they intended to; they represented only that slice of it that interested the official observer," writes Scott. "They were maps that when allied with state power would enable much of the reality they depicted to be remade."
In short, top-down planners needed a literal top-down view of society with which they could work their schemes. It's an approach that Walz's administration has enthusiastically endorsed.
His state's Executive Map Portfolio aren't merely maps of Minnesota. They're maps of things about Minnesota that Walz wants to use government policy to guide, manipulate, and change.
The portfolio includes maps of universal school meal programs, electric charging stations, natural gas use, grocery store access, and more—all subjects of government interventions Walz has championed or signed off on.
Scott, in Seeing Like a State, wasn't inherently opposed to maps or some top-down interventions. When the subjects of maps, and the policy ambitions behind them, are simple, they can be immensely helpful.
He probably wouldn't have a problem with Walz's administration publishing maps on lead pipes for use by homeowners and local governments trying to improve their water quality.
But Scott was incredibly skeptical of the ability of central planners to effectively implement their schemes in a way that actually made people better off. Maps are simplifications of societies and individuals with their customs, local knowledge, and ways of doing things. Even the most detailed map cannot account for all that detail.
Their danger then is that they can breed hubris in state officials who too easily mistake the crude, simplified reality of a map for an accurate, comprehensive guide to a society that's far more complex.
Walz gave every indication that he is in fact that hubristic about the power of maps. "You have to have a plan" for "how we're doing power and economic justice and environmental justice….The tools for that plan are GIS," he said at that GIS conference.
For instance, the climate change portion of Minnesota's map portfolio includes a "social vulnerability index" that pulls in a wide range of demographic data to rank Minnesota counties by how "vulnerable" they are.
The idea behind such an index is that a "social vulnerability" score is a meaningful number that can be meaningfully manipulated by public policy.
Walz has talked about how mapping COVID test rates, positivity rates, and case counts was essential in guiding the state's response to the pandemic—which was heavy on capacity restrictions, mask mandates, and more.
Few of those policies did much of anything to affect the spread of COVID-19. Mapping that data did seem to give Walz the confidence that they would, however.
At that GIS conference, Walz said that "GIS helps build trust." A government official who's that into GIS should also breed suspicion.
Rent Free is a weekly newsletter from Christian Britschgi on urbanism and the fight for less regulation, more housing, more property rights, and more freedom in America's cities.


Show Comments (18)