What Happened at the House Science Committee Hearing on the State of the Climate, and Why It Matters
Extreme weather events around the globe have tripled since the 1980s, but what's happening in the U.S.?
The House Committee on Science, Space, and Technology held its first full committee hearing Wednesday titled, "The State of Climate Science and Why It Matters." One of the experts who testified before the committee was Dr. Jennifer Francis, who is an atmospheric scientist at the Woods Hole Research Center in Massachusetts. Francis testified, among other topics, on how climate change is affecting natural disaster trends.
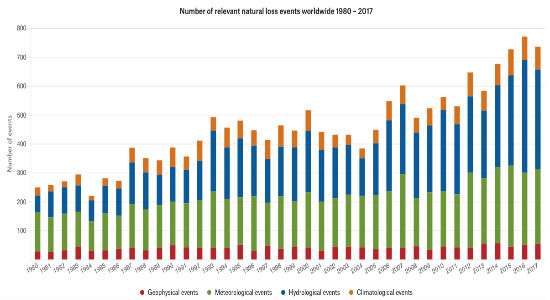
"It's not your imagination: extreme weather events have become more frequent in recent decades," she declared. As evidence she cited data from the reinsurance giant Munich Re, whose analysis finds that the occurrence of extreme weather events around the globe have nearly tripled since the 1980s.
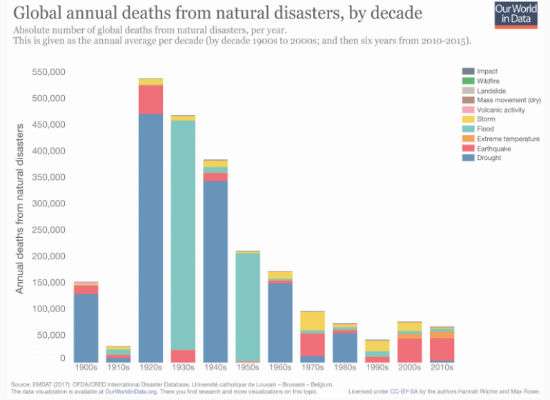
Those data are the data. But something else interesting is going on, too. First, people are becoming more resilient to natural disasters, and particularly to weather disasters. Globally speaking, far fewer people are dying from natural disasters. As the invaluable Our World in Data reports, around 500,000 people per year use to die in droughts and floods back in the 1920s and 1930s, while fewer than 100,000 per year died (chiefly of earthquakes) in the 2000s and 2010s.
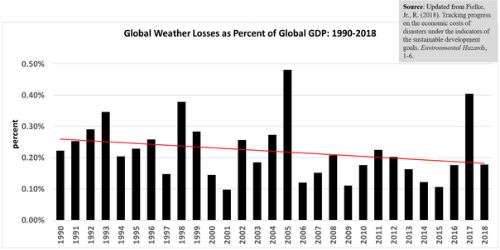
Also using Munich Re data, University of Colorado political scientist Roger Pielke, Jr. calculates that the trend of weather disaster losses, as a percentage of global GDP, trended downward from 1990 to 2018. As global GDP rises, absolute losses may increase even as percentage losses decline. In other words, people seem to be building more stuff faster than worsening weather can destroy it.
Since this was testimony in Congress, what do the disaster trends in the United States show? Let's stick with Munich Re's meteorological, hydrological, and climatological events categories.
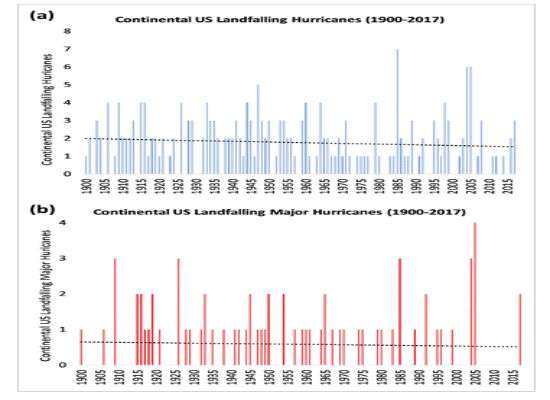
Meteorological events chiefly refer to storms. The biggest and most damaging storms to hit the United States are hurricanes. A 2018 article in the Bulletin of the American Meteorological Society (BAMS) reported that the U.S. hurricane landfall frequency has been trending slightly downward since 1900.
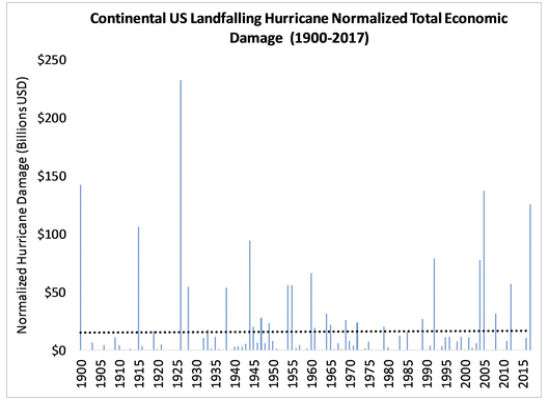
The BAMS article also normalizes losses by estimating direct economic losses from a historical storm as if that same event were to occur under contemporary social conditions, and finds no significant trend since 1900.
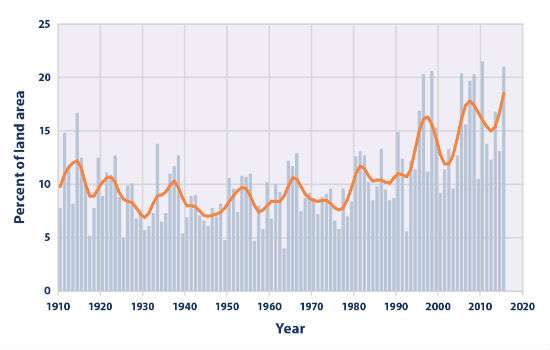
On the other hand, rising global temperatures means in general that the atmosphere can hold more moisture, and that moisture eventually falls as rain or snow. The National Oceanic and Atmospheric Administration reports that 2018 was the wettest year in the past 35 years, and the third wettest year since the modern record began in 1895. Hydrological events, such as heavy rainfall over the continental U.S., have been increasing. In these instances, a greater-than-normal portion of total annual precipitation has come from extreme single-day precipitation events. In other words, spring showers now have a greater tendency to become spring downpours.
As the U.S. Environmental Protection Agency (EPA) notes, increased river flooding is associated with heavier rainfall. Overall, the agency notes that large floods have become more frequent across the Northeast, Pacific Northwest, and northern Great Plains, and have decreased in the Southwest and the Rockies.
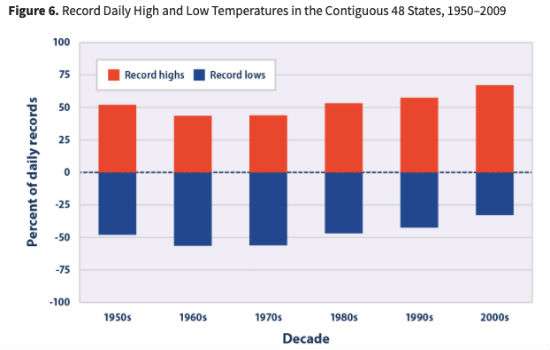
Climatologically speaking, temperatures in the lower 48 have been trending up. The EPA reports two satellite data trends showing that since 1979, average temperature in the 28 contiguous states is rising at a rates of 0.29 to 0.46°F per decade. As a result, the number of record high temperatures is increasing while the number of record lows is declining.
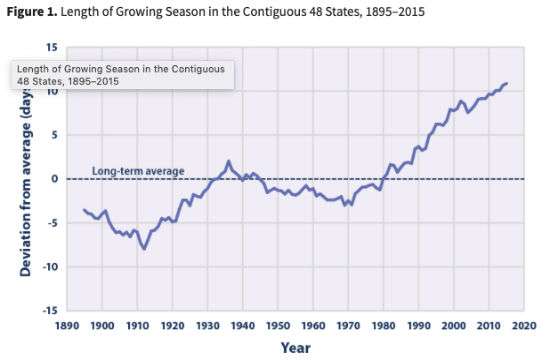
In addition, as a consequence of warmer temperatures, the growing season has lengthened by an average of more than 12 days since 1970.
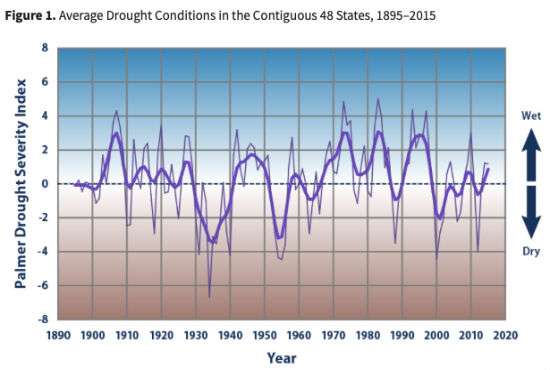
The Palmer Drought Severity Index, averaged over the entire area of the contiguous 48 states, shows no clear trend since 1895. The 1930s and 1950s saw the most widespread droughts, while the last 50 years have generally been wetter than average.
The vast majority of climate researchers have concluded that man-made climate change due to loading up the atmosphere with extra carbon dioxide from the burning of fossil fuels is changing the weather. Unabated emissions could make it much worse by 2100.
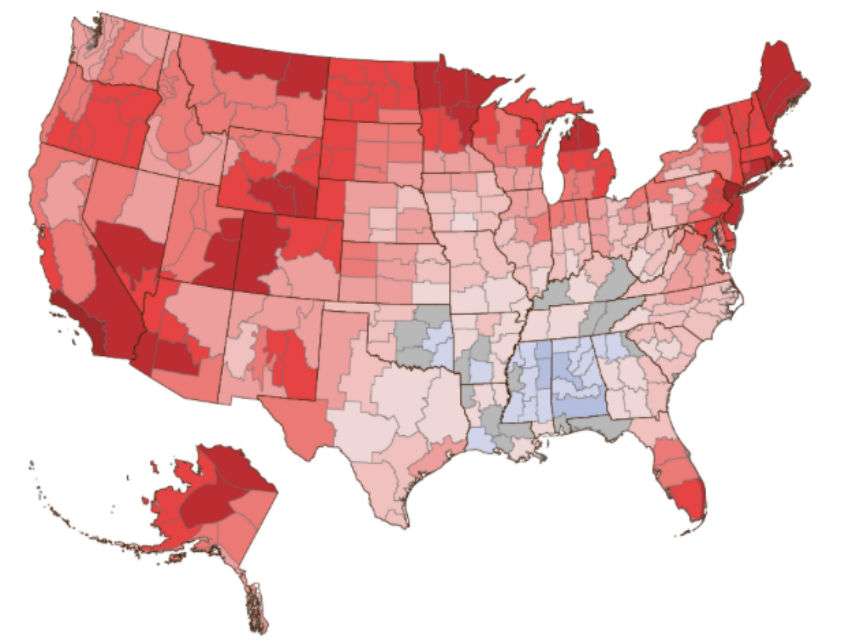
Interestingly, a 2016 article in Nature concluded that climate change so far has actually improved the weather for most people in the United States. "We find that 80% of Americans live in counties that are experiencing more pleasant weather than they did four decades ago," reported the researchers. "Virtually all Americans are now experiencing the much milder winters that they typically prefer, and these mild winters have not been offset by markedly more uncomfortable summers or other negative changes."
However, as greenhouse gas concentrations continue to increase and boost temperatures over the course of this century, the weather may become significantly less pleasant for many Americans. Using some worst-case assumptions, the 2050 Weather team over at Vox created an intriguing interactive map which shows how much hotter your city is projected to become in 2050 by comparing it to another American city generally further to the south. Whether a generation from now the folks in Scranton, Pennsylvania, will find it disastrous to be living with weather now current in Loudoun County, Virginia, is not entirely clear.
In any case, let's acknowledge that unaddressed man-made global warming could well become a big problem. But other than noting that the recently proposed Green New Deal is the wrong way to fix it, we have a long way to go in terms of figuring out the right mix of policies to deal with climate change.


Show Comments (226)