Cyclic Analysis
A dynamic new approach to technical analysis
The corporation concept has been in existence since the 1300's—and negotiable equities on the North American Continent date from the issuance of Hudson Bay Company stock in about 1670. Despite this long history, it wasn't until after the turn of the last century that serious thought was given to why equity prices vary, and in what manner. At about that time several important events took place:
1889. THE WALL STREET JOURNAL came into existence, and with it, a wealth of accurate and readily available information on price movements as a function of time.
1896. The Dow Jones Averages were created and published. This provided graphic visibility to the form of price change versus time.
1900. Louis Bachelier wrote his provocative and scholarly paper "Theory of Speculation" that became the basis for the random-walk theory of price variation. [1]
1902. S.A. Nelson compiled Charles Dow's ideas in THE ABC OF STOCK SPECULATION. [2]
Thus, within this brief span of time, documented price data became available, the random-walk theory was proposed, and one of the first technical approaches to stock market trading and investment was born.
In the following years, market enthusiasts split into three distinct groups:
- Fundamentalists, holding that price movements principally reflect changes in the circumstances related to a company and its products or activities.
- Academicians, unable to improve significantly on the Bachelier premise that price movements are random within reflecting bounds.
- Technicians, finding particular, frequently recurring, price patterns in the past to be the harbingers of prices to come.
None of these three viewpoints really comes to grips with the problem of making money consistently in the stock and commodity markets. The random-walk theory discourages all hope of capitalizing on price fluctuations. Fundamentalists must similarly ignore the immense profit potential of price oscillations. Furthermore, the occurrence of fundamental "forcing" events is found to be nearly as unpredictable as price change is held to be by the random-walk theory. Classical technical analysis has demonstrated serious deficiencies. While the frequent appearance of empirically defined price patterns is a definite fact, applications have suffered from lack of a coherent theory on which to base methodology. Furthermore, none of the existing approaches provides a basis for a self-contained, logical, and complete solution to the money-management problems of issue selection, transaction timing, and transaction yield optimization.
Fortunately, recent years have seen the birth of a fourth viewpoint in which such capabilities are inherent. This viewpoint is based on the Wave Theory of Price Action, and the landmarks of development are indicated by the following events:
1938. Ralph Nelson Elliott published his well-known monograph "The Wave Principle." [3]
1940. In Pittsburgh, The Foundation for the Study of Cycles was formed.
1958. The Society for the Investigation of Recurring Events was organized in New York.
1960. The author initiated a study of the way in which human decisions are made. Equity price data was chosen for this study on the assumption that price changes reflect human decision processes. Unexpected results were obtained in the course of computerized analyses of this data. It was found that price movement can be described as a complex combination of periodic functions with specific interrelationships. This work has continued to the present, resulting in a Theory of Irrational Decision Processes.
1971. An outgrowth of the Theory of Irrational Decision Processes was the Wave Theory of Price Action. A book was published by the author describing practical applications of Wave Theory to the timing of stock market transactions. [4]
1971. Computerized aids to Wave Theory analysis of stock and commodity price histories became available for public use. [5]
1973. The first complete description of wave concepts as applied to the capital management problem was published. [6]
The common element between these and other related events was the mounting evidence independently offered by hundreds of researchers that a remarkable degree of periodicity characterizes time-series data describing a wide range of real-world situations—among these, the price movement of auction-market equities.
In the last decade several facts have emerged as outstanding:
- There is very little of the random in the price movement of negotiable equities.
- Fundamental considerations do enter the picture, but in a quite unexpected way.
- The price movement of negotiable equities consists almost entirely of a complex combination of wave motions with many of the predictive implications of simple wave functions.
- The same wave functions and characteristics discovered in equity prices are found to be operative in many other situations as well.
Thus, 70 years after the events which first made it possible to question whether or not a governing law exists behind the apparently aimless meanderings of equity prices, some of the answers are beginning to emerge. Even more important, the art that has been called technical analysis has now become far less an art and much more a science. Methods of making use of the predictive capability implicit in the developing Wave Theory of Price Action are presently in existence and in use—and prediction of future equity price movement, however imperfect, is the name-of-the-game in trading and investing.
The remainder of this article will describe in brief the methods now being employed for making use of the Wave Theory of Price Action.
AN EVOLVING NATURAL LAW
In the last 10 years it has become increasingly evident that the widespread periodicity observed in many kinds of data implies a common cause, or forcing function. Such universal and common forcing functions are usually ascribed to a law of nature. In this instance, the emerging natural law can be stated as follows:
Numerous real-world situations, including the price behaviour of negotiable equities, reflect a common, complex, periodic forcing function. Change in the affected situations is describable as the sum of many simple wave functions. The particular waves composing the sum are a specific, describable subset in the infinity of possible such subsets. The relationships between wave variables are reasonably constant and are common to all of the situations involved.
The commonality feature implied in this law is remarkable and quite general. The same wave functions and wave-variable relationships are found to be operating in the price movement of all stocks, commodities, bonds, warrants, rights, etc.—whether traded on the New York, Tokyo, London, or other exchanges, and without regard for the time period considered. Even more remarkable, all or a portion of the same specific wave subset is dominant in the time variations of weather data, grasshopper abundance, tree ring formations, lynx procreation, bacteria division rates, and the catch of fisheries, to name only a few of the reported examples.
This natural law, as applied to explain the price movement of negotiable equities, is the Wave Theory of Price Action mentioned in the preceding section. Methodology developed to apply this theory to trading and investment problems is called Cyclic Analysis.
WAVE FUNCTIONS AND RELATIONSHIPS IN PRICE MOVEMENT
The Wave Theory of Price Action is embodied in a set of eight Basic Principles of Cyclicality as described in reference 6. The most significant relationships involved have to do with waves, the elemental building blocks of periodic processes.
An ideal wave (shown in Figure 1) varies smoothly and uniformly about a value of zero, alternately assuming positive and negative values. One complete repetition of a wave is called a cycle.
Only three parameters are required to completely characterize a wave (see Figure 1):
- Period, the length of time elapsed from trough to trough
- Amplitude, the size of the wave from trough to crest
- Phase, the time position of the wave with respect to any given reference time.
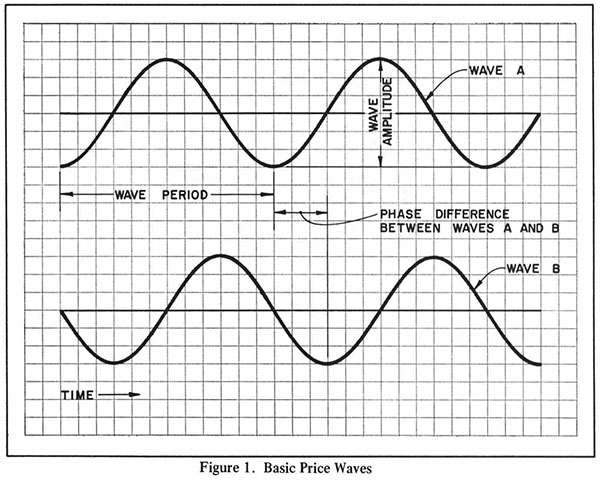
In Figure 1 the phase parameter has been transformed to the more useful quantity phase difference, which is a measure of the relative position in time of one wave with respect to another.
The most important wave characteristic is periodicity. As one cycle of a wave is completed, another identical cycle is commenced. It is readily apparent that once the three basic parameters of a wave are known, the value of the wave can then be ascertained for all possible values of time—including the future. It is this ingredient of the Wave Theory of Price Action that implies predictability of future price movement.
The Principles of Cyclicality state that the price movements of all negotiable equities consist of the sum of the same set of waves with the same interconnecting relationships between the wave variables (period, amplitude, and phase). Thus, price history differences among equities are due solely to minor variations in the values of these wave variables at any given time, with the minor variations in wave variables causing large variations in the sum due to the large number of waves involved.
There is no known limit to the number of waves in the set that combine to form equity price movement. Some of these waves have periods measured in minutes, while others require many years to complete one cycle. Fortunately, it is not necessary to identify and sum all such waves in order to make use of the phenomena. Only a rather small number of waves is needed to permit useful conclusions to be drawn regarding the probable future course of equity prices. Thus, the potentially vast complexities of the Wave Theory of Price Action are reduced to the relatively simple effects and characteristics of a finite set of waves. The resulting simplified model is then used as the basis for Cyclic Analysis.
Price waves exhibit a series of extremely significant interrelationships that are identified in the Principles of Cyclicality. The most important of these are as follows:
- The periods of the component waves vary about, but remain close to, a particular subset in the infinity of possible subsets of periods. This relationship is referred to as nominality.
- The ratio of the average periods of contiguous waves in the nominal wave set is a small, whole number, usually two. This is known as the property of harmonicity.
- The amplitudes of waves in the nominal set are approximately in proportion to the wave periods. This is the property of proportionality.
- The waves in the set are so phased as to cause wave troughs to occur simultaneously whenever consistent with harmonicity. This property is referred to as synchronicity.
- Total price action consists of the algebraic sum of all waves operating in a given equity at a given time. This is a statement of the linear wave combination property and is spoken of as the summation effect.
- An additional relationship, known as the property of variation, will be dealt with in the next section.
These not-to-be-expected, but highly useful, wave relationships are responsible for most of the characteristics of equity price movement—including the recurring pattern phenomena of most classical charting methods. The implications are enormous, and the whole of Cyclic Analysis is founded on these premises.
The nominal wave periods referred to in relationship 1 are further simplified for ease of remembering to a nearly harmonic set as follows:
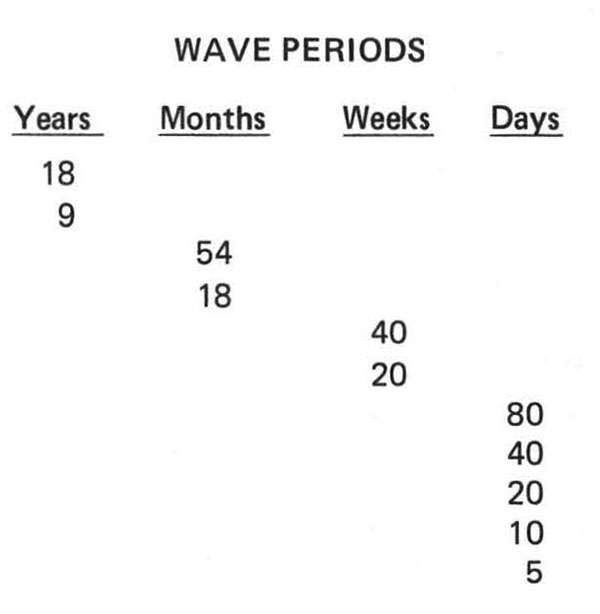
This set of wave periods is spoken of as the nominal cyclic model. It should be noted that an important exception to the period ratio of two occurs in the case of the 18- and 54-month waves, the periods of which are related by a factor of three.
The property of proportionality implies that the amplitude of the nominal 10-day wave is twice that of the 5-day wave, etc.—but that the amplitude of the 54-month wave is three times that of the 18-month wave.
The properties of synchronicity and harmonicity lead to the expectation that at the time of a trough of any given wave, a trough will also occur for each wave of shorter period. Thus, wave troughs tend to form in groups called nests-of-lows. The converse is true at wave crests in that synchronicity and harmonicity preclude time groupings of wave crests. This effect is responsible for the narrow, sharp bottoms and the rounded, oscillatory tops that characterize equity price movement.
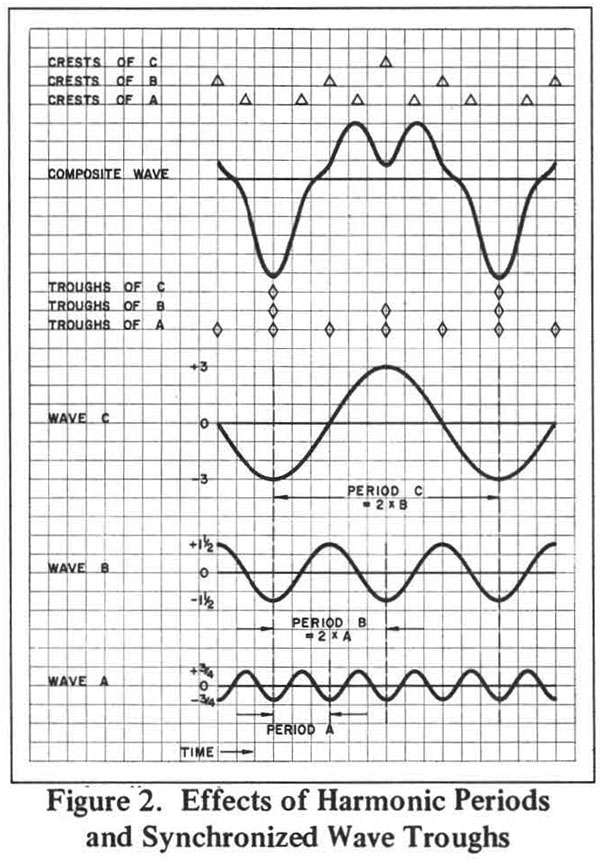
The phenomenon is illustrated in Figure 2, where a set of three ideal, synchronous, harmonic, proportional waves are summed to produce a simple composite wave representative of price movement. The diamonds below the composite wave show the time locations of the troughs of waves A, B, and C and of the resultant nests-of-lows. The triangles above the composite wave are located at the time positions of the crests of waves A, B, and C and show how wave crests fail to occur in groups. The composite wave itself shows the characteristic sharp bottoms and rounded, oscillatory top found in actual price movement.
THE INTERACTION BETWEEN WAVES AND FUNDAMENTAL EVENTS
The description given so far of price motion as a function of waves is ultra simplistic. The complexities encountered in assembling a useful model of price change can, however, be conveniently grouped under the heading of wave modulation.
When three or more ideal waves having certain specified interrelationships are summed (the periods are not harmonically related, but are rather close together), a special modification of a single ideal wave is produced. Such a modified wave is said to be modulated. A modulated wave retains most of the predictive advantages of an ideal wave, but amplitude and period fluctuate slowly as time passes.
In actual price movement, it is found that the waves in the nominal cyclic model are not single ideal waves at all. Instead, each wave is made up of a bundle of closely spaced waves that sum to form a modulated wave. The average periods of these modulated waves correspond with those given in the nominal cyclic model. The fluctuations in the period and amplitude of these modulated waves are referred to as the property of variation.
This property of price waves is then further complicated by the effect of fundamental events. The impact of news releases, earnings expectations, product development, and the like is wholly absorbed as an orderly amplitude change in a contiguous-period subset of the nominal cyclic model. The result is additional modulation of the basic price waves. The extent of fundamentally induced amplitude variation and the number of waves affected depends on the nature of the fundamental event and on the degree to which this event alters volume interest in the equity.
The all-important result of this behavior is that fundamental events do not disturb the periods or phases of price waves—and therefore do not disturb price movement timing predictions. Instead, the wave amplitude changes involved cause a change in price volatility. If a fundamental event has a high impact or is persistent, waves with relatively long periods will undergo amplitude changes. When this happens, the equity price will exhibit a relatively long lasting rise or fall (depending on the nature of the fundamental event) upon which the oscillations of the shorter waves are superimposed. These fairly common long lasting rises or falls are termed pseudo trends and may persist for weeks, months, or even years. They are produced entirely by the normal summing of waves in the cyclic model, but the longer waves in the model have undergone amplitude changes as a result of a fundamental event.
From a theoretical standpoint, the interaction of fundamentals with cyclicality can be considered to be a part of the modulation effect already present.
In light of this curious behavior of price waves in response to fundamental events, several previously puzzling aspects of price movement can be explained:
- Cyclic predictions, such as the price reversals at nests-of-lows, are made entirely on the basis of past price history. Yet, invariably, when these predictions come to pass, a suitable fundamental event is present to "account" for the resulting price response.If the subsequent price movement is in accordance with the usual expectations for a cyclic model with normal wave amplitudes, then it is likely that the fundamental event cited as "causing" the price reversal was merely the one event, among the many events that are always available, that was selected by the analyst as best fitting the circumstances under consideration.If the subsequent price movement exhibits a pseudo trend, either short-term or long-term, then it is likely that a true fundamental interaction is present. Further, it is likely that the fundamental event was in synchronism with the cyclic model for equity price movement because it was brought about by the same human decision processes that produce price movement.
- The use of Cyclic Analysis by a large number of investors does not destroy the wave behaviour of price movement. Such use constitutes an alteration in volume interest, which is the intermediate result of any fundamental event. Thus, the effect on price waves is identical to that produced by any other fundamental event; namely, amplitude increase in a subset of waves resulting in volatility change, but no change in price-reversal timing.
- Fundamental events such as the activities of Federal agencies in regulating money supply can be shown to correlate with price behavior around 54-month price lows and highs. Yet such 54-month waves have been present in price movement throughout market history, including the time before these agencies existed. This observation is subject to the same explanatory comment as item 1 and serves to emphasize the point.
It is this very important relationship between fundamental events and price wave amplitudes that makes possible a wholly technical basis for forming stock and commodity transaction decisions.
PREDICTING PRICE REVERSAL TIMING
Wave Theory permits precise definitions of such concepts as trend and trading cycle to be derived. Quantitative definitions of this sort are significant benefits of great practical utility. Nevertheless, these accomplishments are minor by comparison with Wave Theory's ability to estimate price reversal timing in the future.
It is clear that practical use of wave concepts is dependent on the ability to separate individual wave components from past price data and to estimate the periods and phases of these waves. The Cyclic Analysis process used to accomplish these aims is called formal phasing analysis, or FPA. The methods employed in conducting an FPA are predominantly graphical and include the use of computer generated aids. [5] These methods are described in detail in reference 6.
An FPA results in the identification of the time position of each trough of each wave of the cyclic model active in a given issue at the time of the analysis. From this information the average period and the phase of each wave are obtained.
The average wave period and the period variation experienced in the past are then extrapolated from the latest identified wave trough, repeatedly, until the trough timing for each wave of interest is estimated for any desired portion of future time. In this way, estimated time positions (with tolerance limits) for future nests-of-lows are established.
Powerful assistance in the process of wave trough location is provided by the properties of nominality, harmonicity, and synchronicity through the following considerations:
- The resulting wave period estimates must fall within a known range of the nominal model wave periods.
- The known harmonic relationships between contiguous wave periods must not be violated.
- The estimated future time positions of successive wave troughs must continue the synchronized pattern of trough locations established in past time.
Price reversals in the upward direction are then expected to take place at the estimated times established for future nests-of-lows—within the tolerance range determined in the FPA. The number of wave troughs involved in a nest-of-lows provides an immediate indication of the potential strength of the reversal.
Price reversals in the downward direction are predicted by establishing the estimated time positions of future wave crests. Since these crests are not synchronized, the actual component wave whose crest is most likely to be associated with the price high is determined from predictions of future trend and the resulting time translation of price high relative to wave crest.
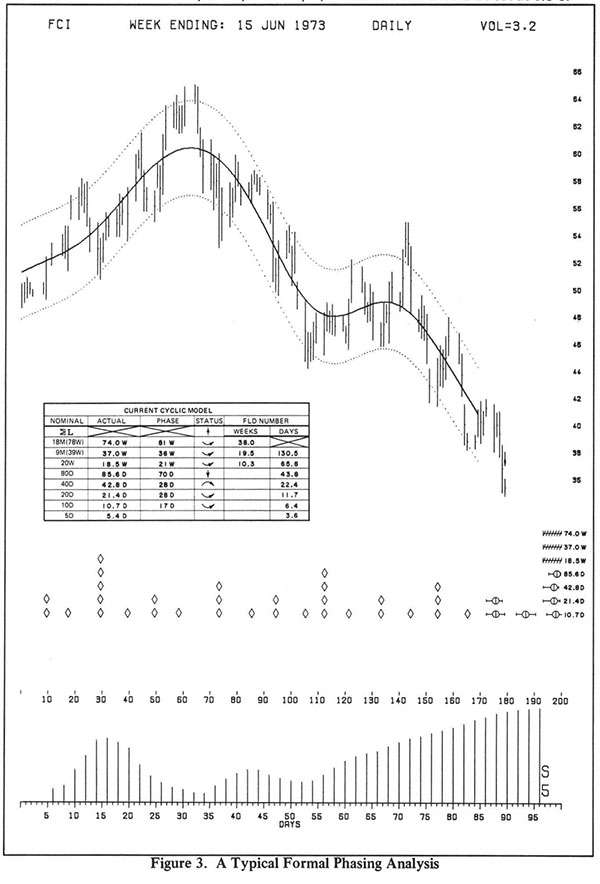
From the foregoing, it can be seen that Wave Theory provides a way to estimate in a logical fashion the future time of occurrence of price reversals that will be followed by price moves of any desired magnitude in either direction. The Cyclic Analysis methodology used in the prediction of price-reversal timing is demonstrated in Figure 3. This is a typical graphic display of the kind in use for the analysis of stocks and commodities. [5] The price and time grid lines normally present have been removed for the sake of clarity in reproduction.
An FPA has been performed and the wave trough locations are indicated by diamonds below the price bars. The Periodogram at the bottom of the chart is computer-generated and provides estimates of the wave components active in this particular equity at the time of the analysis. This Periodogram and the smooth envelope enclosing the price bars are the primary computer-generated tools used in carrying out the FPA. The average wave periods resulting from the FPA are shown to the far right of the associated rows of diamonds, and several of the extrapolated future time positions of nests-of-lows are indicated. The expectation demonstrated is for a price reversal in the upward direction to occur in approximately two to three weeks, powered by the reversal of all waves up to and including the nominal 18-month wave.
The tabulation shown on the chart is known as a current cyclic model and is a compact way of organizing the information gained from an FPA. In this table, the periods of the nominal cyclic model are shown to the left for comparison with the actual FPA average periods obtained. Wave phase is tabulated in terms of time elapsed since the last identified wave trough. The arrows shown are developed from phase status and show the current direction of action of each wave. The columns at the far right contain numbers derived from average wave periods which permit construction of graphic devices for price-move prediction.
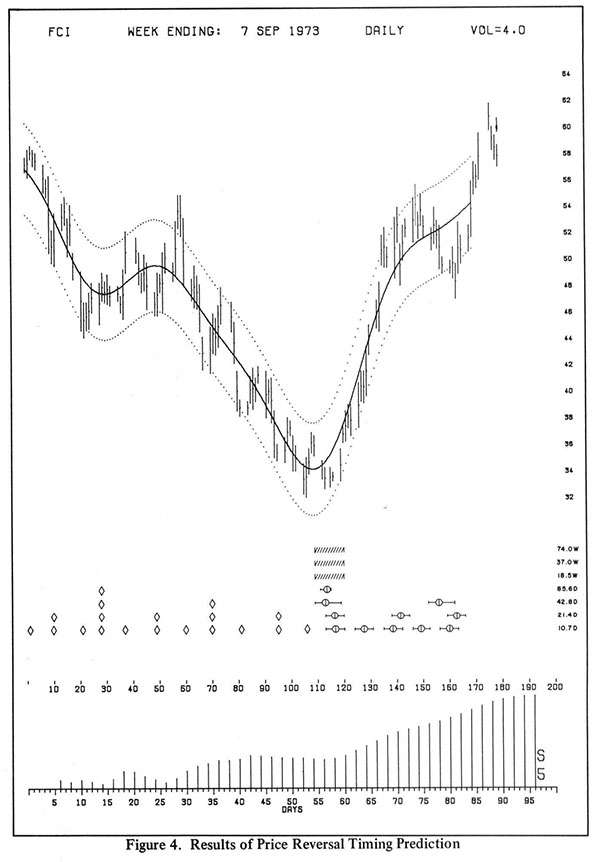
Figure 4 shows the same equity at a later time with the price-reversal timing predictions from Figure 3 overlaid for comparison. It is seen that the predicted timing was very close indeed and that the reversal resulted in a price move from 32 to the 60's. Except for predictable minor oscillations, prices subsequently moved uninterruptedly to the region of 90 before the effects of this powerful nest-of-lows subsided.
A COMPLETE TRADING SYSTEM
A fully integrated trading system must have the following characteristics and capabilities:
- Permit preplanned investment goals
- Supply issue selection criteria
- Permit pretransaction evaluation and comparison for transaction selection purposes
- Provide for automatically triggering transaction entry
- Provide for intratransaction analysis for the purpose of optimizing transaction termination.
As these capabilities are discussed individually in the following paragraphs, it will be seen that the preplanning of investment goals is closely tied in with several of the other capabilities of the system.
Issue selection is a particularly simple proposition in the application of Cyclic Analysis. Since the approach is wholly technical, the industry represented, the products supplied, and other fundamental considerations are incidental. The equity is considered only as a set of price-time data against which Cyclic Analysis procedures are to be applied. In practice, a set of several equities is maintained in an analyzed condition. Such a set is called a stable. Criteria for stable selection include corporate stability, price volatility, equity fluidity, and sufficient uninterrupted data to permit computerized analysis operations. These elements are judged with investment goals in mind.
Pretransaction evaluation is a direct fallout of the Wave Theory analytical processes discussed in previous sections. To develop this point, the following definitions are needed:
- Transaction risk: the probability that any single transaction will result in a capital loss instead of a capital gain.
- Risk potential or risk: the amount of capital that may be lost if the transaction fails.
- Profit potential or potential: the amount of capital that will be gained if the transaction succeeds.
- Percentage potential: potential expressed as a percentage of invested capital.
- Potential-risk ratio or PR ratio: the ratio of potential to risk.
In practice, investment goals are preset in terms of these parameters. For example, transaction risk should be set at 0.5 or less. The PR ratio should be set at 3.0 or more. And the percentage potential should be set at 20 percent or more.
To illustrate, let us suppose that Cyclic Analysis has identified an upcoming possible long transaction by the usual means of trading cycle potential evaluation and FPA prediction of price-reversal timing. Assume that further analysis [6] predicts a price move to 31 from an expected transaction entry price of about 19. A predicted price objective for the trading cycle low at the upcoming reversal leads to the expectation that the stop-loss level can be set at about 17.
Simple relationships connect these transaction variables as follows:
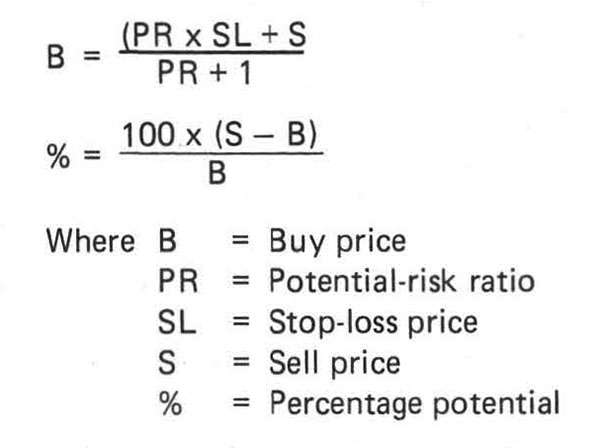
Similar relationships are available for short transactions and for margined and commodity trades.
In the example cited, these relationships would be used to produce the following tabulation:
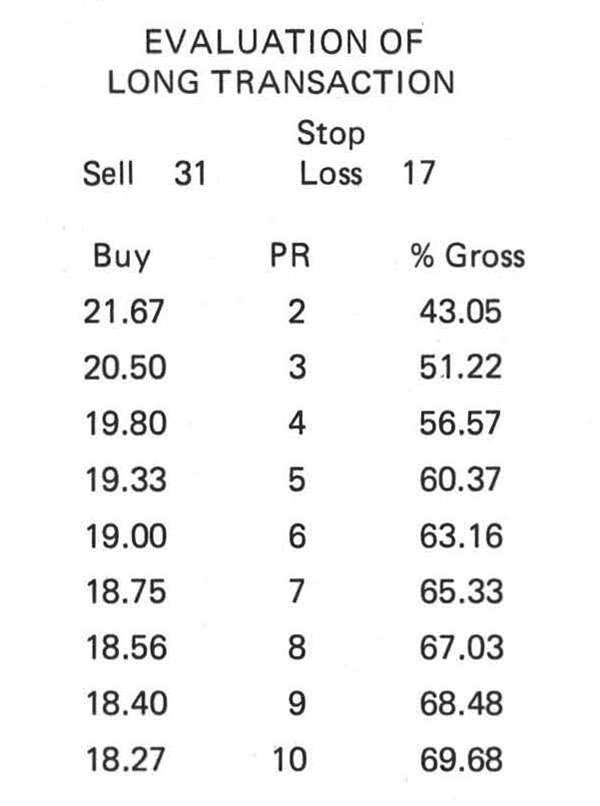
From this tabulation we can arrive at the following conclusions:
- A buy at the price of 19 would result in a PR ratio of 6.0 and a percentage potential of 63.16 percent, both quite acceptable.
- The maximum acceptable buy price is 20.5 because that price would result in the minimum acceptable PR ratio of 3.0. The resulting percentage potential would be 51.22, also acceptable.
The following points should be noted: this evaluation is produced prior to the price reversal on which the planned transaction is based; this evaluation can be compared with those of other potential transactions in order to select the transaction that is most advantageous; and any desired investment goals can be implemented at will by simply changing the acceptable parameter values. Thus, the ability to conduct transaction selection on a quantitative comparative basis has been achieved—along with the preplanning of investment goals.
Cyclic Analysis provides the action signals (known as VTL's and FLD's [6]) needed to prevent errors in wave assumptions from increasing transaction risk to unacceptable levels. Once an action signal is selected, equity price movement is tracked to determine the exact transaction entry time, or preset orders are issued to the broker.
Once a transaction is entered, it is continuously monitored by means of intratransaction Cyclic Analysis. Wave and price events are predicted, and actual events are compared with these predictions to determine the transaction progress situation.
There are three transaction progress situations: on track, better than expected, and worse than expected. Each transaction progress situation is associated with definitive modes of transaction termination in such a way as to minimize losses and maximize gains.
If the transaction is classified as either better than expected or worse than expected, then a change in the mode of transaction termination is called for. It may also be necessary to modify the wave assumptions on which the transaction was based. The nature of these modifications influences the selection of the new mode of transaction termination.
It should be realized that the operation of a trading system such as the one described here produces a net yield based on the results of a series of transactions. For example, suppose that average transaction risk for a number of transactions taking place during a year's time is as low as 0.5—meaning that as many losses are incurred as gains. Such an operation can still be immensely profitable if the PR ratios average 3.0 or better, since the average gain is then three times the average loss. Cyclic Analysis has the potential of achieving transaction risks on the order of 0.2 or 0.3, with correspondingly increased profitability.
CONCLUSION
The steadily accumulating and increasingly convincing evidence of the cyclic character of many natural and man-made phenomena provides a fascinating field for study and research. One result of such research, the Wave Theory of Price Action, grew out of an investigation of man's decision making processes. Continuing research may eventually uncover a common causative factor behind this and other similar, but seemingly causatively unrelated, phenomena.
In the area of the practical application of this new cyclic knowledge, there is little question that continuing research will lead to increased understanding of the Wave Theory of Price Action. Also, the applications, methods and techniques embodied in Cyclic Analysis will undoubtedly be improved, particularly in the area of computer-generated aids.
In the meantime, the present state of the art has proven extremely useful. Cyclic Analysis methods have been in the field since December 1971. The techniques involved are documented in detail in reference 6, and the computerized analysis aids described here are available as reference 5.
James M. Hurst was educated at Kansas State, Brown, and Washington Universities, majoring in physics and mathematics. Following World War II, Mr. Hurst specialized for 25 years in electronics systems design for aerospace applications. In 1969, Mr. Hurst founded Decision Models, Inc. for the purpose of further developing decision theory and wave concepts as applied to the equity markets. The CycliTec aids to cyclic analysis of equities resulted and were initially published in 1971. A complete training course in these methods followed in 1973. Copyright 1974 by J.M. Hurst.
NOTES AND REFERENCES
[1] Louis Bachelier, "Theory of Speculation," ANN. SCI. ECOLE. NORM. SUP. Vol. 3, No. 1018 (Paris: Gauthier-Villars 1900).
[2] S.A. Nelson, THE ABC OF STOCK SPECULATION. (Nelson 1902) (republished by Taylor in 1934).
[3] R.A. Elliot, "The Wave Principle" (a series), FINANCIAL WORLD 90 (1939); also included in NATURE'S LAW (Elliot 1946).
[4] J.M. Hurst, THE PROFIT MAGIC OF STOCK TRANSACTION TIMING (Prentice-Hall 1971).
[5] STOCK AND COMMODITY CHART SERVICES (San Francisco: CycliTec Services, 500 Sansome Street).
[6] J.M. Hurst, CYCLITEC SERVICES TRAINING COURSE (San Francisco: CycliTec Services 1973).
This article originally appeared in print under the headline "Cyclic Analysis."