Congressional Research Service Releases Study of Mass Shootings
One criminologist's reaction: "This report should calm the fears that many people have that these numbers are out of control."
The Congressional Research Service (CRS) has just released a report on mass shootings, drawing on two large chunks of data. The first is the FBI's series of supplemental homicide reports from 1999 to 2013, as buttressed by various scholars who have done their best to fill the gaps and fix the errors in the police statistics. The second is a dataset assembled by Grant Duwe, a criminologist at the Minnesota Department of Corrections and the author of Mass Murder in the United States: A History. Duwe—who tells me he thinks the CRS "did a really good job"—looks specifically at mass public shootings, and his data go all the way back to 1970. (We'll get to the distinction between "mass shootings" and "mass public shootings" in a moment.)
What does the study have to tell us about these sorts of crimes? Here are some questions it answers:
Have mass shootings become more common?
Slightly. The average number of mass shootings was a little bit higher in 2009–2013 than in either of the previous five-year periods, and the average number of casualties was more substantially higher. (*) The study attributes both increases essentially to one outlier year, reporting that they "were largely driven by a few incidents in 2012. If 2012 were excluded, the averages would actually have been lower than the preceding five-year period."
James Alan Fox, an expert on mass murders who teaches criminology at Northeastern University, says the clearest pattern in the study's data is simply "a great volatility in the numbers. There's no solid trend."
Do most of these shootings look like Columbine?
There's a number of different definitions of "mass shooting" floating around out there, but the CRS report defines it as any gun crime where four or more people are murdered in a single incident. Most Americans process the phrase more narrowly than that: They think of random shootings in schools, at work, and in other public places. The CRS describes these as "mass public shootings," and it distinguishes them from two other categories: "familicide mass shootings," in which the murderers kill family members, usually in private spaces or in remote and secluded settings; and "other felony mass shootings," which are committed in the course of another crime (such as a robbery) or common circumstance (such as an argument that gets out of hand). In theory, these categories can overlap, but the CRS researchers assigned each incident to just one category. (**)
Just as most shootings are not mass shootings, most mass shootings are not public shootings. There have been an average of 4.4 mass public shootings per year since 1999. The figure for familicides is 8.5 and the other-felony count is 8.3.
If mass public shootings are less common than other mass shootings, why do they inspire so much more fear?
Public shootings tend to attract more press coverage than familicides. (The same day a gunman killed two strangers in a Louisiana movie theater last month, two teens in Oklahoma were arrested for stabbing five family members to death. The Louisiana story got much more attention.) Family murders also tend to spark a different set of emotions. After an apparently random public massacre, the CRS report notes, people frequently think "It could be me." With familicides, "there appears to be a counterrationalization, 'It would never happen to me.'"
With the "other felony" category, the authors add, "a significant percentage of those incidents are drug- or gang-related, or involve persons engaged in other risk-laden, illegal activities. Because of this, there is sometimes little collective sympathy in afflicted communities for the victims."
Have mass public shootings become more common?
Using Duwe's data, the CRS found an increase in the number of mass public shootings since the 1970s: There was an average of 1.1 incidents per year in that decade, 2.7 per year in the '80s, 4 in the '90s, and 4.1 in the 2000s. The shootings also became a bit more deadly over the same time period, with '70s shootings killing an average of 5.5 people per incident and '00s shootings killing 6.4. (***)
Those are raw totals, without taking population growth into account. If you look at the number of victims per capita, the average has gone up a little from 1970 to today but the numbers are so small that the fluctuations are essentially statistical noise. "Basically, there is no rise," says Fox, the Northeastern criminologist. "There are some years that are bad, some that are not so bad."
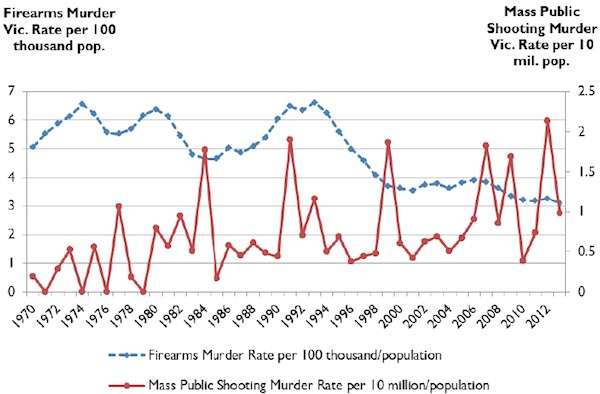
The following chart from the report shows the number of mass public shooting victims per 10 million Americans from 1970 to 2013. As you can see, it has gone from oscillating between 0 and 1 to oscillating between less than .5 and just over 2. As if to underline just how unusual these crimes are, the chart also shows the rate of all gun murder victims in the same time period. (****) That figure's been falling for two decades:
Is there a larger lesson here?
The report shies away from finding a broad message in the data, but Fox—who praises the study as "very thorough"—sees a moral here. "No matter how you cut it, there's no epidemic," he says. "This report should calm the fears that many people have that these numbers are out of control."
(* Specifically: From 1999 to 2003, there was an average of 20.8 incidents per year, with 95.8 people killed and 22.4 wounded. In the next five-year period, the average number of incidents fell negligibly to 20.2, the average number of people killed went up to 99, and the average number of people wounded declined to 19.4. And in 2009-2013, the number of incidents increased to 22.4, the number of people killed went up to 116, and the number of wounded rose to 46.6.)
(** For example, the data include four shootings that could have been classified as familicides but were instead counted with the mass public shootings because of where they took place.)
(*** There are obvious problems with comparing a four-year period to several 10-year periods, particularly when it includes what may be an outlier year. But for the record: From 2010 to 2013, the average number of incidents per year was 4.5, with 7.4 people killed per incident.)
(**** That rate is per 100,000 people, not per 10 million. The two trendlines have to be scaled differently because mass public shootings represent such a tiny percentage of gun murders.)