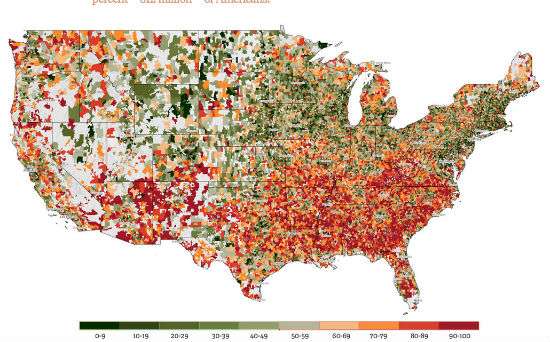
Economically Left-Behind Americans Vote Trump
Trump's margins of victory were considerably larger in distressed counties than in more prosperous counties.

Who votes for Trump? Living in economically distressed communities is pretty good predictor of Trump support.
Using the new data from the Economic Innovation Group's Distressed Communities Index (DCI), I have selected two counties each from the ten Republican primary states with an eye to seeing how the votes played out on Super Tuesday. The counties were chosen before any votes were reported. The Economic Innovation Group report finds that for Americans living in distressed communities, "the years of overall U.S. economic recovery have looked much more like an ongoing downturn. Large swathes of the country are indeed being left behind by economic growth and change."
My hypothesis is that Republican primary voters in the high DCI counties (distressed communities) would tend to vote Trump whereas the folks in the low DCI (prosperous) counties would more likely vote Rubio or Cruz.
In the top 80 percent of distressed communities (scores range from 1 being least distressed to 100 as most distressed) the researchers find that "nearly one-quarter of adults have no high school degree and 55 percent of adults are not working. In addition, the median income of these neighborhoods stands, on average, at only 68 percent of the state's median income. Nearly one in seven homes stands vacant, and 27 percent of individuals live in poverty." These communities also "saw employment decline by 6.7 percent and the number of businesses shrink by 8.3 percent."

In the communities that the researchers defined as prosperous they report only 6 percent of residents are without high school diplomas; the poverty rate is 6 percent; 35 percent of adults are not working; the housing vacancy rate stands at 5 percent; and the median income ratio is 146 percent. Also, the best-off one-fifth of U.S. zip codes enjoyed 17.4 percent job growth and saw the number of business establishments in their neighborhoods rise by 8.8 percent.
In each state I have selected one county with a low DCI score and one with a high DCI score; usually one is next to or just one county over from the other. Except in the interesting case of Massachusetts, my hypothesis was more or less confirmed.
With the exceptions of Texas and Oklahoma, Trump won in both distressed and prosperous counties. However, the real estate mogul's margins of victory were considerably larger in distressed counties than in more prosperous counties. Setting aside the states of Texas, Oklahoma, and Massachusetts, Trump tallied more than the combined votes of both Cruz and Rubio in all of the selected distressed counties except in the case of Arkansas. On the other hand, in the prosperous counties, the combined votes of Rubio and Cruz would have beaten Trump.
Cruz was the victor in Texas and Oklahoma, but again, Trump came closest to beating the Lone Star State senator among voters in distressed counties.
The oddest result in this analysis comes from Massachusetts. Trump got an absolute majority of votes in more prosperous Plymouth County whereas he got just a dominating plurality in relatively worse off Hampden County.
Minnesota divvies up its delegates selected via caucuses by Congressional district. True to form, Trump came closest to victory in the relatively distressed District 8 whereas Rubio triumphed in the more prosperous District 3.
Below: The DCI score for each county is the first number in parenthesis and the rounded vote percentages follow.*
Alabama - Clay County (81.7) Trump 49% - Rubio 21% - Cruz 13%
Shelby County (6.8) Trump 36% - Rubio 27% - Cruz 21%
Arkansas – Montgomery (90) Trump 41% - Rubio 27% - Cruz 18%
Saline (7.7) Trump 32% - Rubio 30% - Cruz 29%
Georgia – Hancock (98.7) Trump 55% - Rubio 15% - Cruz 15%
Henry (8.9) Trump 41% - Cruz 28% - Rubio 21%
Massachusetts – Hampden (51.6) – Trump 48% - Rubio 16% - Cruz 13%
Plymouth (3.1) – Trump 54% - Rubio 16% - Cruz 9%
Oklahoma – Okfuskee (77.5) – Cruz 40% - Trump 31% - Rubio 18%
Cleveland (7) – Cruz 34% - Rubio 28% - Trump 26%
Tennessee – Hickman (91) – Trump 47% - Cruz 30% - Rubio 12%
Wilson (4.1) – Trump 41% - Cruz 27% - Rubio 18%
Texas – Falls (98.1) – Cruz 39% - Trump 35% - Rubio 10%
Comal (4.6) – Cruz 42% - Trump 27% - Rubio 20%
Vermont – Orleans (53.1) – Trump 37% - Rubio 19% - Cruz 8%
Chittenden (3.5) – Trump 26% - Rubio 21% - Cruz 11%
Virginia – Page (83.7) – Trump 51% - Rubio 20% - Cruz 16%
Fauquier (4.6) Trump 36% - Rubio 27% - Cruz 19%
Minnesota – District 8 (52.8) – Cruz 33% - Trump 28% - Rubio 25%
District 3 (3) – Rubio 47% - Cruz 23% - Trump 17%
*Note: I focused on the three Republican front runners and so left out Kasich who did fairly well in Vermont and Massachusetts.
Further note: My town—Charlottesville, Virginia—voted 48% Rubio; 19% Kasich; 17% Trump; and 11% Cruz. DCI score of 37.8.


Show Comments (232)