6 Fast Facts About the FBI's New Hate-Crime Report
Hate crimes against persons decreased in 2015 over the previous year. Anti-black, Jewish, and gay-male sentiment was most common.
The FBI just released new information on hate crimes—defined as "crimes that manifest evidence of prejudice based on race, religion, sexual orientation, or ethnicity"—that occurred in America last year. Here are six key points and takeaways that are crucial to understanding the data.
1. The new report covers incidents that occurred in 2015. This seems like the first important fact to note, since some people have already been trying to pass the data off as a response to Donald Trump's election as president. That's obviously impossible. Trump did start his campaign seriously in the summer of 2015, which leaves open the possibility for his influence on bias-based crimes last year. But other influential events of 2015 include major Islamic terrorist attacks in Paris and Turkey; the mass shooting carried out by ISIS supporters in San Bernardino, California; the rising refugee crisis in Europe; an array of "officer involved shootings," anti-police brutality protests, and Black Lives Matter activism within the U.S.; and the transgender bathroom issue breaking into the mainstream media/political scene for the first time, to name a few. Any serious explanation for a shift in violence against various minorities last year must take all of that (and many other factors) into account, so it's disappointing to see people immediately leap to pin new data to "Trumpism." One needn't feel love for Trump and his fan club to find any explanation that starts and stops with them woefully lacking, partisan, and, to the extent that it clouds out analysis of other factors, possibly destructive.
2. The data is incomplete + inherently increase-prone every year. The FBI collects national data on all sorts of crimes as part of its Uniform Crime Reporting (UCR) program. It has done so since the 1930s. In 1990, it started specifically collecting data "about crimes that manifest evidence of prejudice based on race, religion, sexual orientation, or ethnicity," or what it calls "hate crimes." The first FBI hate-crime statistics included reporting data from just 11 states. Since 1990, the number of law-enforcement agencies participating in the FBI's hate-crime reporting program has grown relatively steadily, meaning that in terms of sheer number of incidents, part (or perhaps all) of any increases may be attributed to an increase in the number of jurisdictions and agencies reporting hate-crime data to the FBI.
The 2015 statistics include information from law-enforcement agencies representing some 283,884,034 people, or about 89 percent of the U.S. population. This is actually down from 2014 and 2013 (when 15,494 and 15,016 agencies participated, respectively), but up from 2012, when just 13,022 participated.*
3. Hate-crimes against persons are down over last year. The FBI reported a total of 5,850 incidents from 2015 that it categorized as hate crimes, up slightly over 2014, when 5,479 incidents were reported. Overall, 65 of these biased-based incidents were classified as "crimes against society," 3,646 as "crimes against persons," and 2,338 as property crimes (with some incidents counted in more than one category). This represents a decrease in crimes against persons since 2014, when 4,048 such crimes were reported.
4. Nearly two-thirds of all hate crimes involved no physical violence. Of all 2015 incidents that the FBI deemed hate crimes, a little more than one third—36.5 percent—involved some sort of physical violence against an individual or group of individuals. Simple assault accounted for 24.5 percent of all incidents, aggravated assault for 11.6 percent, rape for 0.22 percent, and murder for 0.14 percent.
Looking at just crimes against people, the most common occurrence was intimidation, which made up 41 percent of the incidents in this category. Simple assault accounted for 39 percent of crimes against people and aggravated assault for 18.7 percent. There were also 13 rapes and 8 murders in 2015 that were classified as hate crimes.
In the property-crime category, vandalism was by far the most common type of incident, accounting for about 73 percent of hate-crimes against property. Robbery, burglary, and larceny accounted for 22 percent, arson for 1.3 percent, and motor-vehicle theft for 0.9 percent.
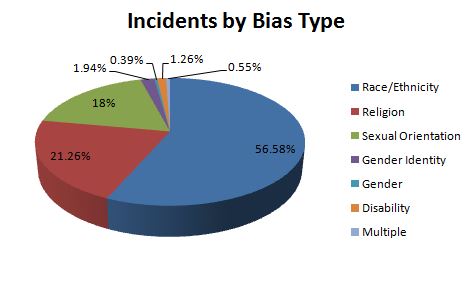
5. Crimes motivated by racial/ethnic bias were the most common type of hate crime. Among crimes deemed "single bias incidents" (i.e., those motivated by just racial animosity, not racial and anti-gay animosity), bias based on race or ethnicity was by far the most common, accounting for nearly 57 percent all incidents. Religious bias drove a little more than a fifth of all incidents (21.26 percent), while crimes motivated by sexual-orientation bias accounted for a little under a fifth (18 percent). The remainder of the incidents were classified as bias against transgender or gender non-conforming people (1.94 percent), anti-disability bias (1.26 percent), gender bias (0.39 percent), or multiple biases (0.55 percent).
6. Blacks, Jews, and gay men were the most common hate-crime targets. For race and ethnicity-related incidents, anti-black bias was the clear leader, accounting for 1,745 of the 3,310 such incidents recorded, or around 53 percent. Crimes categorized as anti-white accounted for just 18.5 percent.
The rest of the racial/ethnic incident breakdown is as follows: anti-Hispanic or Latino bias, 9 percent; anti-Arab bias, 1 percent; anti-Asian, Native Hawaiian, or other Pacific Islander bias, 3.5 percent; and anti-native American bias, 4 percent. About 3.4 percent were classified as crimes against multiple races or ethnic groups, and 7.8 percent of the incidents were classified as "other." There were the exact same number of incidents deemed anti-ispanic or Latino in 2014 (299 incidents) as there were in 2015.
For sexual-orientation based incidents, gay men were way more likely to be targets than lesbian or bisexual counterparts. Anti-gay male bias accounted for 664 of the reported 1,053 sexual-orientation based incidents, or 63 percent. Anti-lesbian bias was behind just 12.9 percent of the incidents, anti-bisexual bias 2.9 percent, and anti-heterosexual bias 1.8 percent. Around 19 percent of the incidents were classified as being based on general anti-LGBT animus. For incidents classified as hate crimes based on gender identity specifically, 64 percent were anti-transgender and 36 percent were against gender-non-conforming individuals.
For crimes motivated by gender-bias, women were the target nearly 70 percent of the time and men 30 percent of the time (though the total number of incidents in the gender category was just 23 incidents).
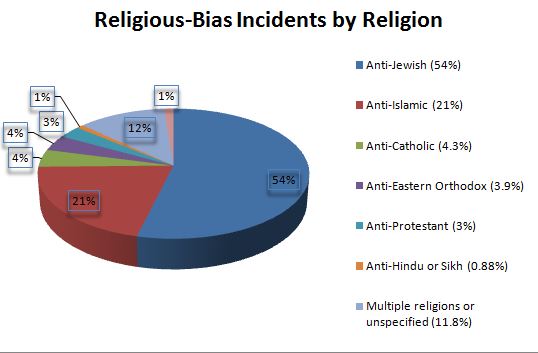
For crimes motivated by religious bias, anti-Jewish sentiment was by far the most common prejudice, accounting for 664 or the 1,244 identified incidents, or 53.4 percent. The next most targeted religion was Islam, with anti-Muslim bias behind 20.7 percent of the incidents. Non-specified religious bias or that which targeted multiple religions was the next most prevalent (11.8 percent of incidents), followed by anti-Catholic incidents (4.3 percent), anti-Eastern Orthodox incidents (3.9 percent), anti-Protestant incidents (3 percent), anti-other Christian incidents (1.2 percent), anti-Mormon incidents (0.64 percent), and anti-Hindu or anti-Sikh incidents (0.88 percent). There were two reports of hate crimes targeting atheists, one anti-Buddhist incident, and one anti-Jehovah's Witness incident. For comparison, in 2014, 154 incidents of religious bias were categorized anti-Islamic, while 609 were anti-Jewish, 64 were anti-Catholic, and 25 were anti-Protestant.
*Updated to add past-year participation numbers.