Washington, D.C. Income Rises as U.S. Economic Freedom Sags

Like a tick on the back of a wounded animal, Washington, D.C. is doing just dandy, thank you, even though the country on which it feeds has been ailing for years. Census data shows that the nation's capital has seen average household income rise by almost a quarter since 2000, even as most of the rest of the country has suffered a decline. It may be no coincidence that, over the same years, the United States slid from second place in a major index of economic freedom around the world to 19th position.
At the Wall Street Journal, Neil Shah writes:
The income of the typical D.C. household rose 23.3% between 2000 and 2012 to an inflation-adjusted $66,583, according to the Census Bureau's American Community Survey, its most comprehensive snapshot of America's demographic, social and economic trends. During this period, median household incomes for the nation as a whole dropped 6.6% — from $55,030 to $51,371…
The Washington, D.C. metro area — which includes the surrounding suburbs in Maryland, Virginia and West Virginia — has it even better, with a median household income of $88,233 that ranks highest among the U.S.'s 25 most populous metro areas. Tampa, Florida's median income, by contrast, is under $45,000.
Shah works from the American Community Survey, a compilation of data as fascinating to mine as it is annoying to provide (which is why the Census Bureau now offers the carrot of offers of a gift card to offset the widely ignored stick of a fine to get people to cooperate, but that's another story). And the data makes clear that the federal goverment and the subsector of the economy dependent on that institution have fattened while the rest of the country has shriveled a bit.
Now contrast this with the just-released Economic Freedom of the World 2013 Annual Report, compiled by a worldwide network of organizations and published by Canada's Fraser Institute. According to that document, the United States steadily slid in its rankings over that same period of time. After scoring consistently between second and fourth between 1980 and 2000, the U.S. plummeted—to 19th place.
The phenomenon is sufficiently remarkable to rate a special treatment by the report's authors, James Gwartney, Robert Lawson and Joshua Hall:
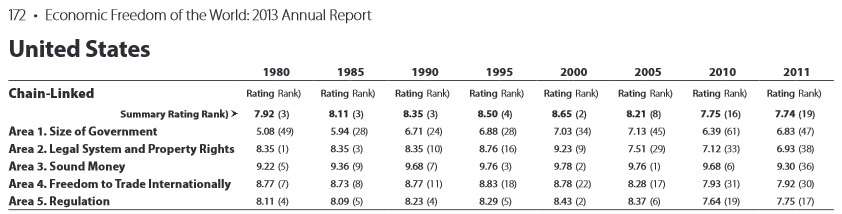
Throughout most of period from 1980 to 2000, the United States ranked as the world's third-freest economy, behind Hong Kong and Singapore. As Exhibit 1.5 indicates, the chain-linked summary rating of the United States in 2000 was 8.65, second only to Hong Kong. By 2005, the US rating had slipped to 8.21 and its ranking fallen to 8th. The slide has continued. The United States placed 16th in 2010 and 19th in 2011. The 7.74 chain-linked rating of the United States in 2011 was nearly a full point less than the 2000 rating.
What accounts for the decline of economic freedom in the United States? While the US ratings and rankings have fallen in all five areas of the EFW index, the reductions have been largest in Legal System and Property Rights (Area 2), Freedom to Trade Internationally (Area 4), and Regulation (Area 5). The plunge in Area 2 has been huge.
The authors attribute the massive plunge with regard to Legal Systems and Property Rights largely to the "use of eminent domain to transfer property to powerful political interests, the ramfications of the wars on terrorism and drugs, and the violation of the property rights of bondholders in the auto-bailout case." But the U.S. has declined in all areas ranked by the index: Size of Government, Legal Systems and Property Rights, Sound Money, Freedom To Trade Internationally, and Regulation. In economic terms, the U.S. is not just a little less free than it was in 2000, but far less free. And it's much less attractive to international investors and entrepreneurs as a place to try to build businesses and create wealth.
Yes, this matters in terms of personal income. Point out Gwartney, Lawson and Hall:
In the top quartile, the average income of the poorest 10% was $10,556, compared to $932 in the bottom quartile in 2011US(PPP) dollars (Exhibit 1.9). Interestingly, the average income of the poorest 10% in the most economically free nations is more than twice the overall average income in the least free nations.
Is it just a concidence that this decline in economic freedom coincides with booming incomes for those dependent on the federal government even as the rest of the country hits the economic doldrums?
Washington, D.C. may be thriving now. but unlike a tick, it has no place to jump if the organism on which it feeds eventually dies.