The Golden Rule of Interest Rates
What can the yellow metal tell you about the price of money?
The gold price is not usually thought of as a leading economic indicator, but it turns out that that is exactly what it is. By following the price of gold over the long term, you can be alerted to changes in the major economic trends several months in advance. For example, gold leads interest rates; the correlation between the two has been in existence ever since gold began fluctuating in the free market 14 years ago. In order to understand this long-term relationship, it is necessary to begin by looking at certain variables and how they relate to one another within the US economic cycle.
The mid-1960s was a major turning point. At that time the government greatly increased spending and debt by fighting the Vietnam war and expanding social programs at the same time. This time period can be distinguished as the beginning of the unprecedented rise in both debt and inflation.
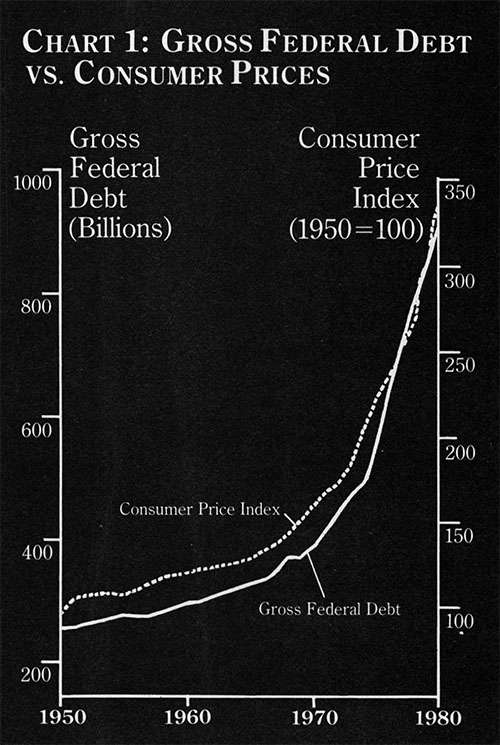
Chart 1 shows US Gross Federal Debt plotted with the Consumer Price Index (CPI), the common inflation index, since 1950. Since 1967 (see arrow), debt and inflation have continued to expand at an unprecedented rate. This chart clearly illustrates the parallel growth in the two; they move up together almost identically. Both are moving in steep, longterm uptrends, with the expansion of debt fueling inflation.
The inflation index on Chart 1 appears to be a nearly straight line up, void of any specific cycle. A totally different picture emerges, however, when we look at Chart 3C, the CPI Inflation Rate Velocity Index, plotted since 1967.
The velocity of any index—how fast it's changing—is plotted on a plus or minus basis in relation to a zero line; most velocities normally cross this line from time to time, indicating a reversal in trend. The velocity of inflation, however, has not been oscillating as other indices do; it has been positive and far above the zero line since 1967, indicating not only that the CPI's major trend since that time has been up but that its growth has been at a nearly exponential rate.
Because the velocity index "blows up" both the long-term trend and changes in the growth of the CPI, the major inflation cycle can be seen. Most apparent is that there has been a consistent pattern of peaks and troughs since 1967. This cycle is not casual: a movement from peak to peak occurs approximately every five years. Each cyclical peak is higher than the previous peak, and each cyclical trough is also higher than the previous trough, thus forming a large, upward-moving "channel," with each progressive cycle becoming more volatile. This cycle, from trough to peak to trough, illustrates, and is a key part of, the economic cycle.
In general, within the inflation cycle, there are inflationary phases up, followed by recessionary phases down. The recessionary phases, however, are nothing more than a "slowing down" of inflation and not major trend reversals. We are currently in such a slowdown period; but keep in mind that the velocity of inflation is still positive, and the major trend is definitely up.
Next, let's take a historical look at another component of the economic cycle, interest rates. Chart 2 shows three short-term rates plotted since 1929: federal funds, 90-day Treasury bills, and the Federal Reserve's discount rate. The interest-rate cycle and the inflation velocity cycle have been moving together and are extremely similar, with interest rates, led by federal funds, moving up in inflationary phases and down during the recessionary portion of the cycle. As the chart shows, the beginning of interest-rate volatility, like the inflation velocity, coincides with the key time period of 1967, when debt expansion began in earnest. As each interest-rate cycle moves higher than the previous cycle, a wide, upward-moving channel is formed. The interest-rate cycle also peaks, on average, about every five years (1966, 1970, 1974, and 1980–81).
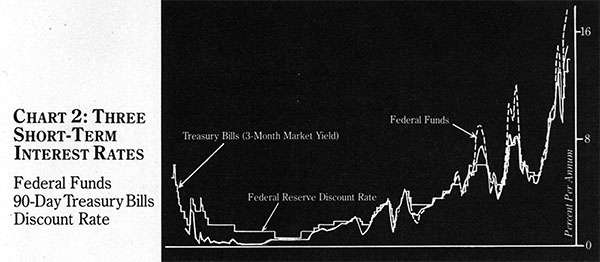
The movements in interest rates over the past 15 years are alarming when looked at in the perspective of a 50-year time span. A comparison of rates today versus 1929 shows that recent interest-rate volatility is unprecedented, just as recent debt expansion and inflation are unprecedented. The fact that all three are at record high levels and move together is not a coincidence; a vicious circle has developed of high government debt and borrowing pushing interest rates up, and high interest rates pushing the debt up further, perpetuating inflation. Debt is the cause; high interest rates and inflation are the effects.
Gold is the keystone of the economic cycle. The gold-price cycle moves in tandem with the interest-rate and inflation cycles, generally rising in the inflationary phases and declining in recessionary phases. And by becoming increasingly more volatile, gold prices, like inflation and interest rates, have formed a long-term uptrend and channel.
Though the three generally move together, Chart 3 shows that gold is always "leading the way." This has been true not only at major peaks and troughs but throughout the cycle. First illustrated on the chart is (A), the gold price, London P.M. fix, plotted in US dollars on a semilog, or ratio, scale. Below gold is (B), a plot of five key short-term US interest rates, also on a ratio scale. (C) shows the CPI Inflation Rate Velocity Index. In comparing these three series, the similarities in their cycles since 1967–68 is most apparent.
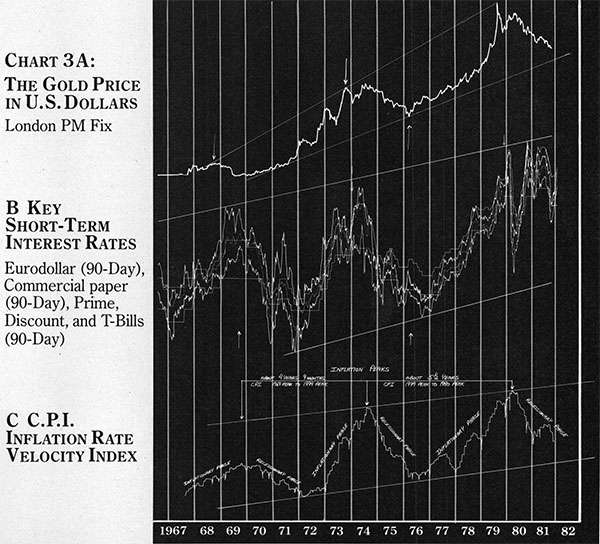
Arrows on the gold chart (A) identify the major cyclical peaks and troughs in the gold price. Notice that cyclical top areas are made up of two peaks; arrows identify the "first gold peak," which is the beginning of the cyclical top area. The arrows marking the first gold peak and the major gold troughs have also been drawn in on charts B and C.
In comparing gold and interest rates (A and B) it can be seen that in each cycle peaks in gold have taken place consistently about three months prior to the beginning of the cyclical top area in interest rates. For example, notice that in 1969–70 there was a large cyclical top area in rates; they remained high for almost a year. Nevertheless, the gold peak occurred three months prior to the beginning of this top area. The same phenomenon occurred in 1980, when gold peaked about two and a half months before the beginning of the cyclical top area in rates.
(We believe that from April 1980 to the present, a massive top area in interest rates has formed which is similar to the 1969–70 time period. This top, however, has had a large distortion that occurred in the spring and summer of 1980 when rates moved down sharply and then rebounded. This distortion, caused by the imposition of credit controls and political maneuvering, has resulted in this top area taking much longer in time in comparison to the 1969–70 top area. This aberration, however, is a good example of how the cycles are becoming increasingly more volatile.)
In being a leader, gold's cyclical movements indicate which way the economy is headed. In general, gold leads interest rates by about two to four months and leads the velocity of inflation by about two to eight months. (The only exception to the rule occurred in December 1969, when the first major gold trough occurred almost two years before the trough in rates and inflation.)
If gold is beginning a major cyclical rise, you can expect inflation and interest rates to begin their rises within months. On the other hand, as gold begins a major cyclical decline, inflation and interest rates will follow. As of this writing, gold and inflation are moving down, but interest rates are still high. This is not a discrepancy; it is an example of gold's function as an early-warning economic indicator. We believe short-term interest rates will come down substantially; our analysis indicates that the prime rate could get as low as 10 percent by the end of 1982. Gold led the way, warning that the economy was moving into another recessionary phase. Inflation velocity followed, decreasing as inflation began slowing down. Though this cyclical top in rates has taken longer than others, interest rates must follow suit by moving down and realigning themselves with the economic realities of this cycle.
In general, what has happened over the past 15 years is the following: Each economic cycle begins with the inflationary phase; during this time gold, inflation, and interest rates are rising. This phase generally lasts about three years. By the time rates and inflation are at their cyclical peaks, the economy is in trouble. Inflation is the overriding worry for the majority of people; food and housing costs are rising rapidly. Everyone is concerned about "fighting inflation" and bringing it down to manageable levels. As money becomes tight, inflation moves down and we enter the recessionary phase of the cycle, which generally lasts about two years. By the time we reach the cyclical troughs in gold, inflation, and interest rates, recession and unemployment have replaced inflation as the national concern and the government feels it must do something to "get people back to work." Money is then pumped into the economy to stimulate a recovery; the economy gains strength and another inflationary phase of the cycle begins. This repeating "sequence of events" of inflation followed by recession has occurred four times since the mid-1960s. This explanation is extremely simplified but, along with the charts, is very helpful in understanding the economic cycle.
Once you are aware of gold's long-term cyclical pattern, the gold price can be used as a gauge of current and future economic conditions and trends. More important is that it will also assist in identifying "where you are" in the economic cycle; once knowing the position, you can then make your business and investment plans accordingly. Currently, the recessionary phase is in force and the trend is down; however, the primary long-term trend has been and continues to be up for gold, inflation, and interest rates.
Debt fuels inflation, and inflationary expectations fuel the gold price. We believe debt will continue to expand because so many of the government expenses are "uncontrollable." Therefore, in the future we should continue to see more of the same: higher levels of inflation, higher gold prices, higher interest rates, and a continuation of the debt-caused cycles.
The Adens are market researchers specializing in precious metals, interest rates, and currencies. This article is based on excerpts from the Aden Gold Study, an extensive report on gold and its relation to the economic cycle since the mid-1960s.