Looking for a Silver Lining
Has silver finished its plunge?
When I first began investing and trading in silver, the major bullish argument was the shortfall in the world between reclamation and new mine production (supply) and total consumption, including coinage (demand). In 1980, for the first time in over 20 years, that shortfall changed into a surplus. This is a profound change: the supply/demand equation that had been so favorable for silver for so many years has now turned bearish.
SUPPLY-SIDE SILVER Even the difference between consumption and new mine production that did continue to exist in 1980 was cut in half—to 100 million ounces, versus 178 million ounces in 1979 and an average of 200 million ounces from 1976 to 1979. This figure, of course, is only part of the changing fundamentals, since little of the silver that is recorded as consumed each year is ultimately lost to the world. Ultimate reclamation as a percentage of consumption is very high, and with the higher average prices for the metal we can anticipate that most silver listed as consumed will eventually return to the marketplace.
The experience with supplies from India is an excellent example. India has the largest reported cache of silver in the world and has been a frequent supplier to the world markets, averaging over 46 million ounces per year since 1975. Yet India produces no silver; its entire contribution to world supplies is from recycling!
There was another profound change in the supply/demand equation in 1980. For the first time in history, supplies from salvage exceeded new mine production. Melted coins increased to 55 million ounces in 1980 from 25.5 in 1979, and miscellaneous salvage was 121.5 million ounces in 1980 versus 80.5 in 1979. When prices rose, secondary supplies greatly increased, proving the free market's sensitivity to price. People have been selling silver coins, bars, and in many cases the family heirlooms—silverware, serving trays, bowls, and baubles. During a single cab ride through Baltimore recently on my way to appear on Wall Street Week, I saw six signs announcing "We buy silver and gold." I had a similar experience in Memphis. Probably none of those places was buying silver and gold a few months ago, let alone a year ago. But now they are buying from the public and turning the silver over to the refineries.
Although this massive reclamation effort has had a significant impact on silver bullion supplies, the melting of substantial quantities of US 90 percent silver coins has not, contrary to popular opinion, created new numismatic rarities among the survivors. The realities of supply and demand make this improbable. In relation to the total supply of 90 percent silver coins, the number melted is probably less than 10 percent. This has already moved the "junk" silver coins to a premium over bars, but the likelihood of greater profits on scarce dates in circulated condition is remote.
Although most of the coins are not specifically sorted for dates immediately prior to their melting, they have been sorted by millions of collectors and dealers over the years. My own experience is that, as a group, the coins passing through dealer hands are not worth sorting. Our sampling as far back as 1968 and 1969 demonstrated that it is not profitable to pay a knowledgeable person even the minimum wage to sort the silver bags coming in from the public. I cannot believe that 12 years later the chances of sending a premium coin to the melting pot are better than one in 10,000.
To return to the fundamentals of silver bullion: the recent market has seen a decrease in demand. Industrial consumption in the world was nearly 80 million ounces less in 1980 than in 1979. Production of certain items using silver was phased out or reduced because it was simply too expensive. Use of silver in coinage fell 12 million ounces in 1980—to 15.7 million from 27.8 million in 1979. While consumption was dropping sharply, supplies were increasing. Not only did reclamation increase, but many people were prompted by higher prices to look for new mines. In some cases, they found them; one mine that is larger than any mine now producing silver is expected to be in production some time later this year.
BEAR AND BULL STORIES The significance of these basic changes in the fundamentals for silver cannot be overemphasized. Only the massive accumulation by private buyers of 122.6 million ounces in 1980 absorbed the supplies that would otherwise have depressed prices. But this demand is now reduced, primarily because the public only buys on the way up. As prices decline, speculators tend to become depressed and sell, adding to the supply side and pressuring prices still lower. I am not referring to the professionals, most of whom make more money on the way down than they do on the way up. I'm talking about the "average investor," who may own a 100-ounce bar or a bag of silver. The psychology of the market has shifted to bearish, and over a period of time I think we'll see more of these people selling.
The underlying premise of the technical analysis of markets is that people tend to act as a herd. For example, one of the most commonly used rationalizations for holding on to a losing investment goes like this, ''If I can just get even, I'll sell it." This creates what a chartist calls resistance. If a group of people bought something at $20, for example, and the price fell to $15, many of them are going to sell if it gets back to $20, and their selling will act as a depressant to the market, creating overhead resistance. People herd out the door on the way down and in on the way up, and that is what typically marks bottoms and peaks. It is this herd psychology that contributes to a long-term cycle in the price of silver.
In reviewing silver's price history for the last 20 years (see graph, below), we find peaks in 1963, 1968, 1974, and 1980; the time period between these market tops averages slightly less than six years. Three of these tops were followed by a decline lasting two to four years; the exception is 1963-67, when the price was fixed at $1.29 by government edict. During the periods of decline, silver lost most or all of its
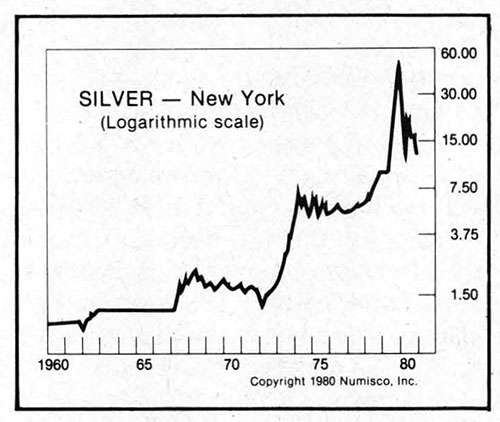
price gain from the previous bull market. In each of these four instances, approximately five years passed before that record price was exceeded. After that record price was achieved and surpassed, it took only about one year for a series of new peaks and a new record that would again stand for about five years. The similarities are too great to be coincidental, so let's take a closer look.
In May 1968, silver peaked at $2.58, exactly double its previous high of $1.29 set in the middle of 1963. It lost 60 percent of that gain in the next six months, then declined all the way back to $1.29 in November 1971.
The $2.58 price was not reached again until February 1973 (57 months after the 1968 high). Almost exactly a year later, in February 1974 (69 months after the previous peak), another long-term top was reached at $6.50. The decline from the 1974 peak was swift; 70 percent of the bull move from $2.58 to $6.50 had been retraced when the price reached $3.75 only seven months later in September 1974.
A trading range of $3.75-$5.25 prevailed until February 1979, when the previous high of $6.50 was surpassed. Once again, it had taken five years for the earlier crop of silver bulls just to get even.
The most recent top in January 1980 occurred 11 months after the most recent appearance of the $6.50 price and 71 months after its 1974 debut. And, of course, nearly all (92 percent) of the gains from $6.50 to $50.35 were given back in the precipitous drop that lasted only two months but trimmed $40.00 from silver's plump $50.35 high. The price did recover somewhat and is now once again drifting lower. At my deadline for this article, March 5, the price is $11.80.
WHEN TO BUY I made my first silver trade in 1967 when a new bull market was forming, and I was there at the 1968 peak. At the 1971 low and at the 1974 high, I was a floor trader in the silver pit. In the years since then, I have continued to trade and invest in silver (there is a difference), and I liquidated all of my holdings and those of my speculator clients on the way up, but not at the top, of this most recent bull market.
The only thing that was different about any of those earlier markets was the numbers. And there is nothing to make the next bear and bull markets any different either. At every previous top, scholarly dissertations and emotional exhortations implored you to buy silver. The bullish case found support in nearly every quarter, from dispassionate researchers armed with reams of statistics to less intellectual types whose fervor bordered on religious commitment. When everyone seemed to have jumped on board, that was the top.
The converse, of course, was true at major bottoms. In November 1971, when silver broke down through $1.30, I can recall projections of 90 cents and even 60 cents by "experts." The former bulls had dissipated their gains by riding the market down. They became so discouraged they failed to recognize that their mount had metamorphosed and they were now riding a bear. When at last they could ignore it no longer, they sold out. The bottom had been reached, and the market turned around.
Markets change their trends, but people tend to act the same way under the same or similar circumstances. People, unlike markets, can be counted on to react to news stories and to the enthusiasm or disparagement they receive from their peers. (Markets, on the other hand, sometimes give us a clue that they may be ready to tire or change directions when they fail to respond to news that should reinforce the existing trend.)
For long-term investors (five years or longer), I advise waiting for a better opportunity to buy. This bull market is dead, and we will have to wait some time, measured in years, for the next one. This is not the time to commit to long-term holdings of silver for at least two reasons. First, there will be a time to buy it cheaper, probably in 1982 rather than 1981. Second, if you purchase now and have the chance to buy at the same price in a year or two, you will have lost the opportunity to invest more profitably in something else in the meantime. Although I don't recommend debt instruments as a general rule, they are a lesser evil than silver at present. If you invest $1,000 now in a two-year US government T-bill or bond at a 14 percent rate, it will be worth about $1,300 at maturity. You would then have more money with which to buy silver—and at lower prices.
The long-term cycle I have discussed suggests that it will probably be mid-1982 before silver reaches its ultimate bottom for this phase and late 1984 or early 1985 before the current record of $50.35 is exceeded. It is also possible that we have seen a very long-range top in the metals and that we will not see $50 silver again for another 20 years. I don't think this is probable, but it is possible—perhaps a chance of one in three or four. Any argument for higher silver prices is based on continued inflation. Continued inflation is not a guarantee of higher silver prices, but it is a prerequisite. If you accept the deflation scenario as a possibility or probability, to that extent you must be bearish on precious metals.
Timing is the most important ingredient in any market decision. Even the worst "cat" or "dog" can be a good buy just before the rally, and the "bluest of chips" can be a profitable short just before the sell-off. Being right long-term can be profitable. Being right at the right time can multiply those profits five- and tenfold.
AND IN THE MEANTIME? I would advise long-term holders to lighten their existing positions if significant rallies (above $14-$15) provide the opportunity. The prospects of buying at or near $10 before the next bull market begins are excellent. Avoid the "what I paid for it" syndrome; what you paid is only relevant for taxes. Look at the dollars and sense of selling now, accumulating interest on the funds at today's high rates, and then doubling the number of ounces you own by reinvesting your sale proceeds and earnings when silver approaches $10 per ounce again. Those who have margin accounts can also save the interest expense in the interim.
Another strategy is to hedge some or all of your silver holdings in the futures market by selling contracts against physicals. You can hedge in 1,000-ounce units on the MidAmerica Commodity Exchange in Chicago, or in 5,000-ounce increments on the New York COMEX and the Chicago Board of Trade. Futures contracts have an interest expense built into the price. That's why the further out you go in time, the higher the price is in the futures market. For example, in early March, February 1982 silver futures on the Chicago Board of Trade were selling at $13.37, $1.57, or 13 percent, over the spot price of $11.80. (I selected February 1982 because it defers profits into a later year and allows adequate time for the bear market to operate. Other contracts carry a commensurate premium when adjusted for the amount of time remaining before expiration.)
If you sold futures against your physical holdings in equal amounts in early March and the price doesn't change by February 1982, you will have made a profit of $1.57 per ounce. If the price rises to $13.37 by February 1982, you will be even. If silver rises above $13.37, you will have lost the profit (above that price) that you would have made without the hedge. And if silver declines from its March price, you will have the $1.57 per ounce profit to offset your loss of equity in your present holdings.
For those of you who are determined to hold on to your silver and not to hedge any of it, I have another strategy, provided that you are also holding some gold: trade the gold for more silver. The ratio of gold's price to that of silver is (in March) about 39:1, down from its recent peak of around 42:1. I believe this ratio will shrink over time; both metals may decline, but gold will decline more than silver. If both rise, I expect silver to rise faster than gold.
Don't expect this to work on a day-to-day or even month-to-month basis, but over the course of years, this ratio should return to 20:1 and possibly all the way back to the 1980 low of 15:1. If the ratio were to return to 20:1, that would allow you to almost double your precious metal holdings without any outlay of cash. At March prices you can trade an ounce of gold for about 39 ounces of silver, and if the gold/silver ratio drops to 19.5:1, you can then trade the 39 ounces of silver for two ounces of gold. (I have omitted commissions, but they should be modest—two to four percent per transaction.)
THEN THERE'S COINS My last, and best, suggestion about "what to do until the next bull market" is to invest in numismatic silver coins. The major advantage of numismatic US coins is that they have kept ahead of bullion during bull markets while resisting the moves on the downside.
Several years ago I constructed an index with which to monitor the general trend of prices for high-quality silver coins. It contains 12 coins representing different types (or designs) and denominations minted in the United States between 1837 and 1916. All of these coins are, and have been, relatively easy to acquire. They are in demand by collectors and dealers alike and are readily saleable.
The year 1971 was chosen as a base since it was the last year in which silver was available at $1.29 an ounce. (An earlier starting point would be even more favorable to the numismatic coins. From the 1930s to 1968, when gold and silver prices remained stable, rare coins appreciated at a faster rate than inflation…but that's another story.)
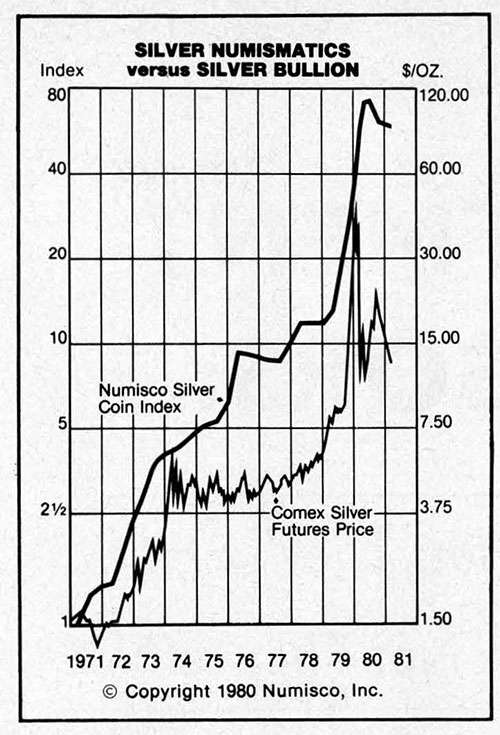
As the graph in the adjacent column demonstrates, numismatic silver coins have consistently out-performed silver bullion over the past 10 years. The only two exceptions to its upward path have been a six percent drop in 1976-77 and an 18 percent drop in 1980. The 1980 decline seems to have been a normal market correction that has given back the excessive, in retrospect, gains of the first half of the year. Our silver coin index has been stable since November and now stands at 59 times its 1971 price. Even at its $50 high, silver bullion peaked at only 33 times its 1971 price of $1.50.
This 10-year survey* of a diversified group of numismatic silver coins demonstrates that investment-quality coins have at least equaled—and during bull markets as much as doubled—the appreciation of gold and silver bullion. More importantly, the rare coins correct by plateauing or by declining modestly instead of the gut-wrenching sell-offs in the metals. The primary reason for this is that holders of numismatic coins generally sell in response to personal circumstances rather than market conditions. If rare coin prices seem to be moving lower or standing still, most dealers and individuals will simply hold their coins in the expectation of higher prices in the future. Their expectations have generally been met.
*Of course, some coins have not done as well as our index, and some have done better. Space does not permit a discussion in this article of how to select an investment coin, but if you would like to receive my "Criteria for an Investment Coin," please send a stamped, self-addressed envelope to Numisco, Inc., 1423 West Fullerton, Chicago, IL 60614.
Walter Perschke is the president of Numisco, Inc., a rare coin brokerage firm in Chicago, and publisher of the Numisco Letter.