Making Stock Market Profits
Genstein. No—it isn't an obscure disease or a fancy ski resort. He's not an international banker. He isn't in politics or under indictment for perjury (the two have come to mean the same thing nowadays). He's a retired scientist, an industrial chemist I believe, who wrote a book published in 1954 under the title, Stock Market Profits without Forecasting.
Genstein describes his system for deciding whether the market is high or low. Being a scientist, he insists on finding, using, and verifying a system of external measurements. The people who use graphs of stock prices are spectacularly in default on this point: they choose the scale of their graphs; they choose the time intervals; they choose the peaks to select or ignore, the troughs to select or ignore; they choose to "widen the channel" every time the results are askew. They project their own ideas onto the data they pretend to be studying. Anyone with scientific training must despise that kind of witchcraft.
Genstein selects two series of figures: the prices of stocks and the cash dividends paid. He doesn't permit himself to intrude into the picture by naming the stocks. He simply uses the Dow Jones Industrial Index (some thirty blue-chip stocks). The "cash dividend" on the Dow is computed and reported every calendar quarter in Barron's and other financial publications. So now we have the regular source of raw data.
Why not the earnings instead of the cash dividends? Because earnings are subject to accounting adjustments, they fluctuate far more unpredictably than cash dividends, and, most importantly, they don't compare readily with alternative forms of investment. Genstein computes the yield on the cash dividend, and it is the yield that fluctuates in competition with other forms of income—interest on bonds, on savings accounts, on real property.
Genstein shows that the yield on the cash dividend tends to fluctuate around a central value. When investors are enthusiastic, they bid up the prices of stocks, even while the managements of the companies are not going overboard to increase the cash dividend proportionately. As a consequence, the yield goes down. This is the familiar situation of the stock that has a great reputation for long-term growth, a reputation so great that investors are willing to forgo the present return, contenting themselves perhaps with the three-percent yield of IBM, in hopes that in 10 years from now the cash earnings and dividends will have increased so steeply that the income will be very satisfactory. Or there can be times of gloom, such as the fall of 1974, when no one seems to want stocks at all. They go begging: yields of nine and ten percent are common at such times, even for fine strong companies with excellent prospects.
But there is always a general level of interest rates (in the general sense of "interest"—the return on investment) that reflects extremely broad and stabilized factors in a society. If the members of society are devoted to current consumption and make no plans for the morrow, they will be unwilling to save money, and the cost of capital will be very high. Hence the normal 30 percent or 40 percent rate of return on money in consumption-happy (translation: underdeveloped) economies. A society whose members think in terms of working, saving, investing, is a society that will have an abundance of capital available in the financial markets—hence a lower general level of interest rates. These societally determined levels of investment return are called originary rates of interest and have nothing to do with inflation rates or the prospect of gain or loss. Originary rates tend to move very slowly—as slowly as the society itself moves from an ethic of saving to an ethic of consuming or vice versa.
Genstein recognizes both the existence of originary interest levels determined by long-term societal trends and the existence of gradual change in those levels. What he does is to construct a rather long-based moving average of cash yields on common stocks. He takes a 10-year period as long enough to cancel out the short-term swings in public moods, but short enough to give notice of current changes in the long-term societal trends.
You can keep a Genstein table up to date with no arithmetic more difficult than adding and multiplying. Here's how to do it:
- Jot down the highest daily closing price of the DJIA in the calendar quarter.
- Jot down the lowest daily closing price of the DJIA in the calendar quarter.
- Jot down the average of #1 and #2 (add them together and divide by two).
- Add up the last 40 entries in column #3.
- Divide #4 by 40, giving you the average DJIA over the most recent 10-year period, quarter by quarter.
- Jot down the dividend on the DJIA for the most recent calendar quarter.
- Add up the last 40 entries in column #6.
- Divide #7 by 10, giving you the average yearly rate of cash dividends on the DJIA for the past ten years.
- Divide #5 by #8, giving you the normal ratio of price to cash dividend (the inverse of yield).
- Add up the last four entries in column #6 (the current yearly cash dividend rate of the DJIA) and multiply the sum by the normal ratio (#9).
- You now have the central value of the DJIA for the moment.
You can now determine, quite coldly and objectively, whether the DJIA is higher or lower than normal. Of course, if it is only a point or two away, you should ignore the fluctuation. Genstein, in fact, has learned that very good results can be obtained by ignoring quite substantial fluctuations. He recommends, for example, that a "buying" point be established by dividing the central value by 1.25, and that a "selling" point be determined by multiplying the central value by 1.25.
And, once you have got this far, you can establish a scale of buying and selling points for yourself. Genstein publishes several different scales, ranging from conservative to speculative. Here is the average:
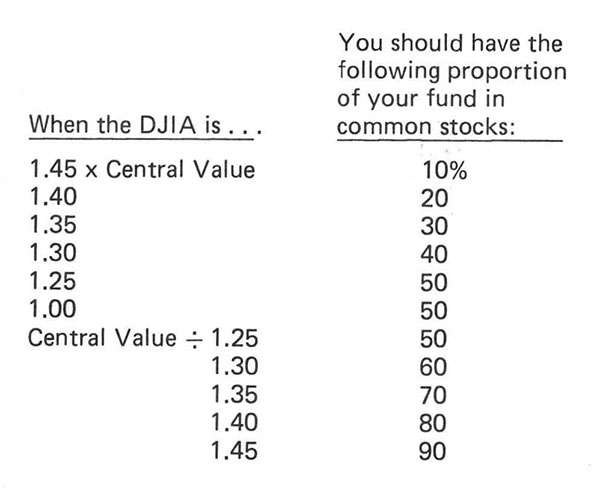
You will note that the system always leaves a certain amount in common stocks just in case. Also, it provides for selling on the way up, laying aside some cash reserves to do that strategic buying when prices get low. Genstein ran the results back over a period of 40 years, from 1914 to 1954, and found that this simple timing device would have permitted a portfolio to outperform the market averages in every year, with an average capital appreciation of about 15 percent. That's tops. And remember: the results would have been achieved throughout wars, depressions, bull markets, revolutions, devaluations, and the rest of the turmoil of the 20th century.
Well, what stocks should you buy? Genstein found that there was no need to buy the entire DJIA. Results were substantially the same if you bought four or five of the DJIA stocks—maybe a bouquet of Union Carbide, DuPont, US Steel, General Electric, and Eastman Kodak. (He does suggest that you diversify the industries even if you buy four or five.) He also discovered that you could simplify your stock-selection problem even further by buying (or selling) a closed-end investment trust, such as Tri-Continental or Lehman Corporation. (And you could enhance the speculative element by trading the Tri-Continental warrants.) No problem with the cash reserves: keep them in cash, in savings accounts, or in Treasury bills. I would prefer the Treasury bills.
What does Genstein's system say now? As I write this, we do not have the 1975 year-end figures—but Genstein is so stabilized that this doesn't really matter. As of September 30, 1975, the column entries were 881.81, 791.69, 836.75, 34,401.03, 860.0, 9.05, 329.56, 32.96, 26.09, 998.73, 798.98, and 1,248.41. This means that the average price of the DJIA for the last 10 years had been 860.0. The average yearly cash dividend on the DJIA for the last 10 years had been 32.96. The normal ratio (price divided by dividends) had been 26.09. The normal ratio applied to the last four quarterly dividends produced a central value of 998.73.
Thus, as of the fall of 1975, the DJIA should be considered normal—neither overpriced nor underpriced—if it was 998.73, and you should have 50 percent of your portfolio in industrial stocks if the DJIA was anywhere between the central value multiplied by 1.25 and the same value divided by 1.25. Thus the normal range of the DJIA was between 798.98 and 1,248.41.
If the cash dividend is maintained, and if the DJIA goes below 798.98, you should increase your industrial stocks to 60 percent of your current market value.
The system requires patience. But it works, it is based on solid theoretical and historical work, it is objective, and it is simple. If you are handling your own investments, you should give serious thought to the Genstein method.
William F. Rickenbacker is an investment advisor and columnist. He is editor of Rickenbacker Reports, a financial advisory, and publisher of the Financial Book Digest. He also writes regular columns for National Review and Private Practice magazines. Copyright © 1976 by Private Practice, reprinted with permission.