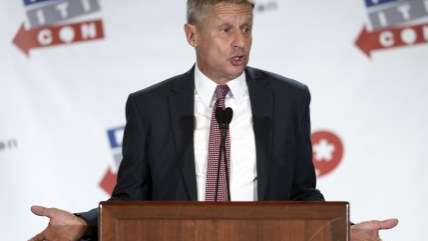
Fifteen percent is the magic number Libertarian presidential candidate and former governor Gary Johnson needs to reach to earn his voice in the 2016 election.
By capturing the support of 15 percent of voters in national public opinion polls, Johnson could join the major party's presidential candidates on the primetime debate stage. With both Democratic and Republican presidential candidates disliked at historic levels and a rising share of political independents frustrated with the two major parties, this is the year a third-party candidate like Johnson has a realistic chance of getting onto the debate stage.
What would it take?
Johnson would need to receive an invitation to participate in the debates from the Commission on Presidential debates (CPD), a private, non-partisan, 501(c)(3) organization that has sponsored the general election presidential debates since 1988. The CPD is not a government entity, nor does it receive government funding. But it is a creation of the two major parties, co-chaired at its inception by both the Republican and Democratic parties' national chairman.
The CPD establishes objective eligibility criteria in advance—compliant with regulations enforced by the Federal Election Commission—that all candidates must meet, including the Democratic and Republican candidates, to be invited to participate in the debate.
The CPD's 2016 debate eligibility criteria, announced last year, are as follows:
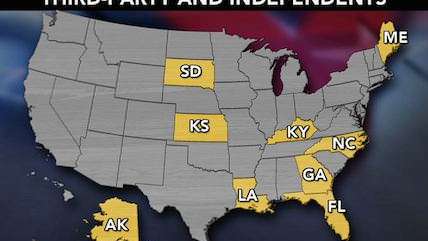
Besides being constitutionally eligible, the candidate would need to appear on a "sufficient number of state ballots to have a mathematical chance of winning a majority vote in the Electoral College." Currently the Libertarian Party has ballot access in 32 states and is confident about getting on the remaining 18.
Next, Johnson would need to have the support of at least 15 percent of "the national electorate" as determined by the average of five selected national public opinion polling organizations' most recently publicly reported results, at the time eligibility is determined.
The CPD board, with the advisement of Dr. Frank Newport, editor-in-chief at Gallup, determines which five polling organizations will be used. The CPD board selects polling organizations based on its assessment of poll methodology quality, polling frequency, size of sample population, and the reputation of the polling organization.
So far, the CPD has not reported when it will reveal the five selected polling organizations for 2016, but will likely do so before Labor Day. The CPD has announced it will formally extend invitations to participate in the first debate after Labor Day and before September 26th, when the first debate will be held at Wright State University.
Although the CPD has not yet released the selected polling organizations it will recognize in 2016, we can look back at those included in 2012 for an idea: ABC/Washington Post, NBC News/Wall Street Journal, CBS/New York Times, Fox News, and Gallup.
The key for Gary Johnson is to convince the major polling organizations to include him in their polls—and to continue to do so . He may be in luck. The 2012 organizations that are polling the 2016 election have included him in their match-ups against Clinton and Trump, with Johnson garnering: Fox (12 percent), CBS (11 percent), NBC/Wall Street Journal (10 percent), ABC/Washington Post (7 percent), an average of roughly 10 percent. Other highly regarded pollsters such as CNN/ORC (9 percent) Quinnipiac (5 percent) and Monmouth (9 percent) have also asked about Johnson this cycle, although they were not included in CPD's 2012 recognized polls.
He's not there yet. But Johnson absolutely has a chance of getting to 15 percent in the polls. Let me explain why.
First, NBC/WSJ polls are finding voters in 2016 are more open to expressing interest in a third-party candidate compared to 2012 and 2008. In 2016, 47 percent of Americans say they would consider voting for a third party candidate up from 38 percent in 2008 and 40 percent in 2012.
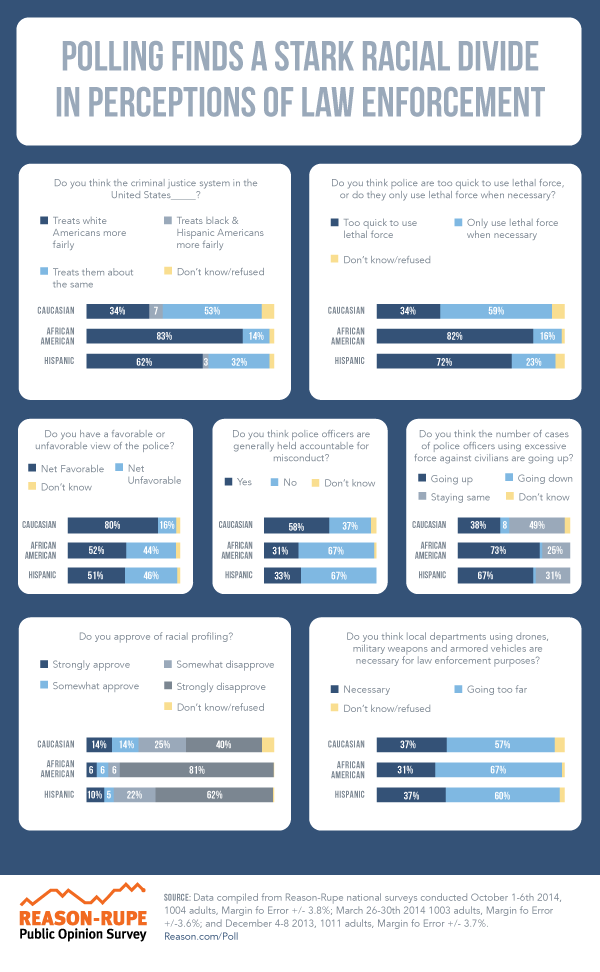
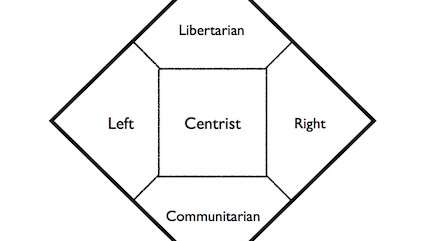
Second, a Reason-Rupe poll found that 48 percent of Americans say they'd be willing to vote for a candidate who described him or herself as "conservative on economic issues" and also "liberal on social issues," which is how Gary Johnson self-describes.
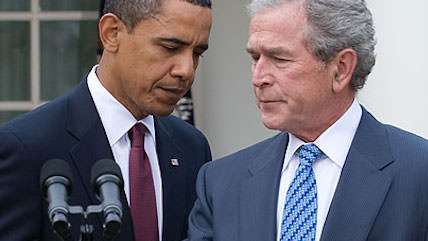
And third, in 2012, a Reason-Rupe poll found that in a hypothetical three-way race between Barack Obama, Mitt Romney, and Ron Paul, Paul got 17 percent of the vote. And Ron Paul wasn't even running as a third-party candidate and was far better known. Back in 2012, 73 percent of voters had an opinion of Ron Paul—far more than the 32 percent of voters who've formed an opinion of Johnson.
To be sure, Americans are far more likely to express support for minor party candidates in polls than they are at the ballot box. However, public polling is what matters for getting into the debates. These data indicate there is an appetite for a candidate like Gary Johnson, and wherever his ceiling may exist, it's likely higher than 15 percent.
If Johnson is on the eligibility cusp, then the CPD may exercise subjectivity in determining whether or not he is allowed to participate in the debates. For instance, it is unclear how the CPD defines "support…of the national electorate" since in practice pollsters have different methods of determining who likely voters are and thus what is the national electorate.
Also, it's unclear if the CPD would measure Johnson's level of support as a function of a three-way race with Trump and Clinton or a four-way race that also includes Green Party candidate Dr. Jill Stein. The RealClearPolitics average currently finds Johnson with 8.1 percent in a three-way race and with 7.8 percent in a four-way race. One can imagine a scenario where Johnson achieves the 15 percent average threshold in three-way races, but not in 4-way races. If so, it would be up to the CPD's discretion to determine if Johnson meets the eligibility requirements.
What's the incentive of the CPD? It important to point out that the CPD has made great efforts to put forth transparent, concrete and predetermined eligibility criteria well in advance of the debates. The CPD came under scrutiny in the 1990s when it used a broader set of more subjective criteria when deciding whether to invite third-party candidate Ross Perot to the debates. Since then, its board has made efforts to articulate clear eligibility requirements in advance that apply to all candidates.
Nevertheless, one must keep in mind the fact that the CPD was established by the two major parties and initially co-chaired by both the Republican and Democratic parties' national chairman. At the time it was established in 1987 the New York Times reported that both the Democratic and Republican co-chairs individually felt third-party candidates should not be included and thus the CPD would "not likely … look with favor on third-party candidates" and likely exclude them from debates. Because why wouldn't they?
Those who have a vested interest in one of the two major parties have little incentive to allow further competition on the main debate stage. Thus, in the event that a third-party candidate like Johnson finds himself on the edge and subjective judgment must be exercised, Johnson may find himself excluded. However, the intense dislike of Trump, particularly among partisan elites, may lend itself to favor Johnson ultimately getting into the debates this year.
Sam Henrick contributed to this research.
The post Yes, Gary Johnson Could Make It Into the Debates. Here's How. appeared first on Reason.com.
]]>A recent Reason-Rupe poll asked Americans to rate their favorability towards capitalism, socialism, a free market economy, and a government managed economy. Americans have the most favorable reaction to free markets (69%), followed by capitalism (55%), socialism (36%), and coming in last was a government managed economy (30%).
Fully 66 percent of Americans have an unfavorable opinion of an economy managed by the government while 58 percent have a negative view of socialism. Only 21 percent reported a negative opinion of free markets but nearly double that, 38 percent, have a negative view of capitalism.
Interestingly, while younger people have a more positive of opinion of socialism and a government managed economy than older people, they are about equally likely to say they favor the free market system and capitalism as older Americans.
Among college-aged Americans, 58 percent report a positive view of socialism and 56 percent a positive view of capitalism. In contrast, only 28 percent of seniors have a positive view of socialism while 61 percent have a favorable view of capitalism. This may give the impression young people are trending socialist.
However, college-aged Americans are far more supportive of a free market system (72%) than they are of a government-managed economy (49%). Seniors concur with young people on the free market system (74%), while only 28 percent have a positive view of a government-managed economy.
Several forces could likely be at play. First, young people don't know what these words mean. The fact that they are more favorable toward socialism than a government-managed economy, which if anything is socialism-lite, demonstrates this. Second, young people like free markets and the technology, products, and wealth it creates, but they also want to feel confident the poor have access to what they need. In their minds socialism might simply connote a social safety net rather than government ownership. Third, individuals often trend left in their youth, but may change as they age. Fourth, this cohort of young people may be systematically different from older generations in holding a preference for both markets and government activism. It remains to be determined how this young generation will make the trade-off when markets and government action are at odds.
Examining other demographics differences confirms that capitalism as a concept is more popular among those with more education and income. For instance, 48 percent of those with high school diplomas or less have a favorable view of capitalism, compared with 62 percent of college grads, and 78 percent of those with post-graduate degrees. Those making more than $90,000 a year are 22 points more likely to favor capitalism than those making less than $90,000 a year (73 to 51 percent respectively).
White Americans favor capitalism over socialism 56 to 29 percent. However, African-Americans report being favorable to both capitalism (51%) and socialism (55%). Hispanics are more supportive of capitalism with 53 percent supportive of capitalism, and 45 favorable of socialism.
Democrats are split in half on capitalism and socialism. Fifty-three percent say they have a favorable view of capitalism and 50 percent a favorable view of socialism. In fact nearly 3 in 10 Democrats have a favorable opinion of both socialism and capitalism.
While independents share Democrats' skepticism of capitalism (48% favorable) they are far less supportive of socialism (33% favorable). Republicans predictably are strongly favorable of capitalism 62 to 33 percent, and fervently oppose socialism 18 to 77 percent.
Seven in 10 tea partiers have a favorable view of capitalism. Excluding tea partiers from the calculation, only a slim majority of Americans, 51 percent, have a favorable view of capitalism.
The decision between the free market economy and a government-managed economy is far less controversial. Roughly two-thirds across racial groups favor a free market economy. Nevertheless, while 26 percent of Caucasians have a positive reaction to a government managed economy, roughly 4 in 10 African-Americans and Hispanics have a favorable view a government managed economy.
Education similarly correlates with attitudes with post-graduates being nearly 20 points more likely than high school grads to favor the free market system (83 to 64 percent). Nevertheless, strong majorities across educational groups like free markets.
Differences are also diminished across income groups: 7 in 10 Americans making less than $90,000 a year have a positive view of free markets, as do 8 in 10 Americans making more than $90,000 a year.
Partisans also agree with 7 in 10 favoring free markets. Yet, Democrats are about twice as likely as independents and Republicans to have a favorable view of an economy managed by the government (41 to 20 percent respectively).
These results indicate that the public thinks differently about the words "free markets" and "capitalism." These words do not carry the same meaning. While Americans don't like either "socialism" or a "government managed economy" that much, socialism is more palatable to Americans than a government managed economy. This implies Americans must not think that socialism necessarily means the government runs the economy. Instead, Americans may think of socialism as government providing social services.
The post Poll: Americans Like Free Markets More than Capitalism and Socialism More Than a Govt Managed Economy appeared first on Reason.com.
]]>A recent Reason-Rupe poll asked Americans to rate their favorability towards capitalism, socialism, a free market economy, and a government managed economy. Americans have the most favorable reaction to free markets (69%), followed by capitalism (55%), socialism (36%), and coming in last was a government managed economy (30%).
Fully 66 percent of Americans have an unfavorable opinion of an economy managed by the government while 58 percent have a negative view of socialism. Only 21 percent reported a negative opinion of free markets but nearly double that, 38 percent, have a negative view of capitalism.
Interestingly, while younger people have a more positive of opinion of socialism and a government managed economy than older people, they are about equally likely to say they favor the free market system and capitalism as older Americans.
Among college-aged Americans, 58 percent report a positive view of socialism and 56 percent a positive view of capitalism. In contrast, only 28 percent of seniors have a positive view of socialism while 61 percent have a favorable view of capitalism. This may give the impression young people are trending socialist.
However, college-aged Americans are far more supportive of a free market system (72%) than they are of a government-managed economy (49%). Seniors concur with young people on the free market system (74%), while only 28 percent have a positive view of a government-managed economy.
Several forces could likely be at play. First, young people don't know what these words mean. The fact that they are more favorable toward socialism than a government-managed economy, which if anything is socialism-lite, demonstrates this. Second, young people like free markets and the technology, products, and wealth it creates, but they also want to feel confident the poor have access to what they need. In their minds socialism might simply connote a social safety net rather than government ownership. Third, individuals often trend left in their youth, but may change as they age. Fourth, this cohort of young people may be systematically different from older generations in holding a preference for both markets and government activism. It remains to be determined how this young generation will make the trade-off when markets and government action are at odds.
Examining other demographics differences confirms that capitalism as a concept is more popular among those with more education and income. For instance, 48 percent of those with high school diplomas or less have a favorable view of capitalism, compared with 62 percent of college grads, and 78 percent of those with post-graduate degrees. Those making more than $90,000 a year are 22 points more likely to favor capitalism than those making less than $90,000 a year (73 to 51 percent respectively).
White Americans favor capitalism over socialism 56 to 29 percent. However, African-Americans report being favorable to both capitalism (51%) and socialism (55%). Hispanics are more supportive of capitalism with 53 percent supportive of capitalism, and 45 favorable of socialism.
Democrats are split in half on capitalism and socialism. Fifty-three percent say they have a favorable view of capitalism and 50 percent a favorable view of socialism. In fact nearly 3 in 10 Democrats have a favorable opinion of both socialism and capitalism.
While independents share Democrats' skepticism of capitalism (48% favorable) they are far less supportive of socialism (33% favorable). Republicans predictably are strongly favorable of capitalism 62 to 33 percent, and fervently oppose socialism 18 to 77 percent.
Seven in 10 tea partiers have a favorable view of capitalism. Excluding tea partiers from the calculation, only a slim majority of Americans, 51 percent, have a favorable view of capitalism.
The decision between the free market economy and a government-managed economy is far less controversial. Roughly two-thirds across racial groups favor a free market economy. Nevertheless, while 26 percent of Caucasians have a positive reaction to a government managed economy, roughly 4 in 10 African-Americans and Hispanics have a favorable view a government managed economy.
Education similarly correlates with attitudes with post-graduates being nearly 20 points more likely than high school grads to favor the free market system (83 to 64 percent). Nevertheless, strong majorities across educational groups like free markets.
Differences are also diminished across income groups: 7 in 10 Americans making less than $90,000 a year have a positive view of free markets, as do 8 in 10 Americans making more than $90,000 a year.
Partisans also agree with 7 in 10 favoring free markets. Yet, Democrats are about twice as likely as independents and Republicans to have a favorable view of an economy managed by the government (41 to 20 percent respectively).
These results indicate that the public thinks differently about the words "free markets" and "capitalism." These words do not carry the same meaning. While Americans don't like either "socialism" or a "government managed economy" that much, socialism is more palatable to Americans than a government managed economy. This implies Americans must not think that socialism necessarily means the government runs the economy. Instead, Americans may think of socialism as government providing social services.
The post Poll: Americans Like Free Markets More than Capitalism and Socialism More Than a Government-Managed Economy appeared first on Reason.com.
]]>The latest Reason-Rupe poll found that 72 percent of Americans are concerned about their state and local government's ability to fund public employee pensions as currently promised. However, only 39 percent say they are "very" concerned while another 33 percent are only "somewhat concerned."
This is reflected in how Americans prioritize dealing with public employee pension reform. Thirty-five percent say public pension reform ought to be a "top priority" for government while another 41 percent say it should be "an important but lower priority" reform. In other words, Americans are moderately concerned about public employee pensions, but have not yet been persuaded it's a crisis.
Part of the reason is that few Americans are aware public employee pensions are estimated to be underfunded up to $4 trillion dollars. (See here and here). To put this in perspective, this estimate exceeds the total amount of money the United States federal government spent in 2014—$3.5 trillion dollars.
Not surprisingly, older Americans, and are thus thinking more about retirement, and fiscal conservatives are more likely to say pension reform should be a priority.
For instance, 32 percent of private sector employees think pension reform ought to be a top priority, compared to 44 percent of retirees. Prioritization steadily increases with age, for instance, 27 percent of college-aged Americans want government to prioritize pension reform, compared to 34 percent among those 30 to 44 years old, up to 44 percent among those over 65.
Tea partiers are also 10 points more likely to prioritize pension reform—and this cannot be explained by age. Indeed, even younger tea partiers prioritize pension reform. Forty-three percent of tea party supporters want pension reform to be a top priority compared to 33 percent of non-supporters. Find more discussion of what the public thinks about public pension reform here.
The Reason-Rupe national telephone poll, executed by Princeton Survey Research Associates International, conducted live interviews with 1003 adults on cell phones (501) and landlines (502) January 29-February 2, 2015. The poll's margin of error is +/-3.8%. Full poll results and methodology can be found here, including poll toplines (pdf) and crosstabs (xls).
The post 35 Percent of Americans Want Pension Reform to be "Top Priority" for Govt appeared first on Reason.com.
]]>The latest Reason-Rupe poll finds that nearly 8 in 10 Americans think that the public should be allowed to vote on increases to public employees pensions and benefits. Support is largely non-partisan with 73 percent of Democrats, 81 percent of independents, and 80 percent of Republicans favoring such votes.
Solid majorities of both public (61%) and private (82%) sector workers also favor allowing the public to vote on such increases. Nevertheless, as one might expect, public employees themselves are more opposed to such a proposal. Indeed government workers are more than twice as likely as private sector workers to oppose allowing the public vote on public pension increases (37 to 16 percent). Find more discussion of what the public thinks about public pension reform here.
The Reason-Rupe national telephone poll, executed by Princeton Survey Research Associates International, conducted live interviews with 1003 adults on cell phones (501) and landlines (502) January 29-February 2, 2015. The poll's margin of error is +/-3.8%. Full poll results and methodology can be found here, including poll toplines (pdf) and crosstabs (xls).
The post 78 Percent of Americans Say Voters Should Get to Vote on Government Employee Benefit Increases appeared first on Reason.com.
]]>The latest Reason-Rupe poll finds that nearly 8 in 10 Americans think that the public should be allowed to vote on increases to public employees pensions and benefits. Support is largely non-partisan with 73 percent of Democrats, 81 percent of independents, and 80 percent of Republicans favoring such votes.
Solid majorities of both public (61%) and private (82%) sector workers also favor allowing the public to vote on such increases. Nevertheless, as one might expect, public employees themselves are more opposed to such a proposal. Indeed government workers are more than twice as likely as private sector workers to oppose allowing the public vote on public pension increases (37 to 16 percent). Find more discussion of what the public thinks about public pension reform here.
The Reason-Rupe national telephone poll, executed by Princeton Survey Research Associates International, conducted live interviews with 1003 adults on cell phones (501) and landlines (502) January 29-February 2, 2015. The poll's margin of error is +/-3.8%. Full poll results and methodology can be found here, including poll toplines (pdf) and crosstabs (xls).
The post 78 Percent of Americans Say Voters Should Get to Vote on Govt Employee Benefit Increases appeared first on Reason.com.
]]>Actuaries estimate public sector pension plans could be underfunded up to $4 trillion dollars. This means that many state and local governments may not have enough money to fund government employees' pension benefits. This could also mean that governments raise taxes or cut services to pay promised pension benefits—thereby holding the taxpayer responsible, or cut pension benefits—holding government workers responsible.
In short: pension reform requires trade-offs—tough trade offs. Governments have largely promised government workers defined-benefit pension plans, which guarantee a regular pension payment for the rest of government retirees' lives. Because they are guaranteed, taxpayers are on the hook regardless of how well government and the employees contribute or how well the market performs. In contrast, private sector workers generally save for retirement with 401-k style retirement accounts based on what they and their employer contribute and market returns. In other words, private sector employees are responsible for their own retirement savings.
The latest Reason-Rupe poll took these difficult questions to the American people to ask how they would make trade-offs between promises made to government workers and taxpayer bailouts of the pension programs. As one might expect, significant differences emerge between public sector workers and private sector workers.
Part of the issue is that private sectors workers think government employees' benefits are better than those with similar jobs in the private sector by a margin of 60 to 36 percent. Moreover, private sector workers tend to hold both government officials and public employees responsible for the underfunded pension problem, while government workers primarily blame government officials. Consequently, private sector workers approve of a number of proposed reforms to control public employee pension costs that public employees predictably oppose.
Calculating Defined Benefit Contributions
For instance, 62 percent of private sector employees favor setting a cap on the dollar amount of annual pension payments government workers are allowed to receive and 33 percent oppose. In contrast, 53 percent of government workers oppose such a salary cap, while 38 percent favor.
Similarly, 58 percent of private sector workers say government worker pensions should be based on salary alone, but government workers think (55%) employees should be allowed to increase their pensions by also counting unused sick time, vacation time, and specialty pay.
Shifting Government Workers to 401k Style Accounts
Many reformers believe that shifting public employees from defined benefit pensions that keep taxpayers on the hook to 401k-style accounts like those in the private sector will be more sustainable in the future and less costly to taxpayers. However, government workers oppose such a transition, and understandably so. Shifting to 401k-style accounts would essentially break a promise (and a contract) made to government workers when they took their jobs and hold them more responsible for saving for their own retirements like private sector workers.
Not surprisingly private sector workers—who largely fund government workers' defined benefit pensions—strongly favor shifting current employees to 401k style accounts by a margin of 65 to 31 percent. However, public employees oppose 52 to 46 percent. Nevertheless, a slim majority of government workers would favor such a reform if it only applied to future government workers, and not themselves (54 percent favor to 43 percent oppose).
When survey respondents were asked if they would favor 401k-style accounts for government workers if it meant "benefits were not guaranteed and would depend on how well the employees and government save and invest," 57 percent of private sector workers continue to favor such a transition, only an 8 point decrease. Public employees would continue to oppose 61 to 37 percent.
The one message tested that persuaded private sector employees to oppose a shift was if "this meant breaking a contract made with public employees when they first accepted their jobs." Fifty-two percent would oppose such a shift and 43 percent would continue to favor. Public employees continued to oppose 73 to 25 percent.
Interestingly, government workers remain opposed to 401k-style accounts even if that means taxes would have to be raised on everyone else or government would have to cut services. Indeed, 56 percent would still oppose a shift if otherwise taxes would need to be raised and 54 would oppose if otherwise government would need to reduce services. Private sector workers were much opposed to both these alternatives, particularly tax hikes. Fully 73 percent would favor shifting government workers to 401k-style accounts if otherwise taxes would be raised and 64 percent would favor a shift if otherwise government services would be cut.
Funding Current Pensions
While shifting government workers into 401k-style accounts may ease the future burden on taxpayers, this does not sufficiently address the current problem of promised, underfunded benefits. Once again, the primary proposed reforms include tax hikes, service cuts, or reforming public employee pensions.
In the absence of concrete trade-offs, both government workers and private sector employees oppose raising taxes or cutting government services to fund pension benefits. Similarly, roughly 7 in 10 of both private and public workers oppose cutting benefits to already retired government employees.
However, the two groups diverge over current government employees. Government workers also oppose (68%) reducing their own future pension benefits while private sector workers marginally favor (51%).
The reform that both public and private sector workers agree upon to deal with underfunded pensions is to increase government workers' required pension contributions (65% of public employees, 88% of private employees favor).
Nevertheless, while government employees are willing to contribute more, they don't think they should have to contribute at least 50 percent of their pensions costs with 53 percent opposed and 46 percent in favor. Conversely, 6 in 10 private sector workers find it appropriate for government workers to contribute at least half of their retirement benefit costs.
While increasing required employee contributions may help alleviate the underfunded pension problem, it will likely be insufficient. In these situations, localities may find their two options are to raise taxes/cut government services or cut public employee pensions. When the trade-offs are presented this way, private and public workers reach consensus:
Nearly three-fourths of government workers and more than 8 in 10 private sector workers would prefer to "renegotiate public employee contracts to reduce pension benefits and make current employees contribute more to their own pension" rather than raise "property, sales, and/or income taxes" or "reduce public services ranging from police and fire protection to recreation."
Particularly striking, when given the choice between tax hikes/service cuts and reducing pensions for already retired public employees, both private (73%) and public (53%) employees oppose raising taxes to pay benefits at current levels. When it comes to government service cuts to pay benefits to already retired government workers, 57 percent of private sector workers oppose, but 52 percent of public employees would favor.
In sum, neither taxpayers nor government workers want to be responsible for fixing the public pension crisis. To be sure, public employees would prefer to not raise taxes or cut services for taxpayers and private sector workers would prefer not to break a contract made with government employees. Nevertheless, public employees tend to prefer policies that would keep taxpayers on the hook for dealing with the crisis, just as taxpayers want government employees to solve the problem on their own. However, when trade-offs are made clear and concrete: either tax hikes/service cuts or renegotiate government workers' contracts to reduce pension benefits, both groups agree on the later.
The Reason-Rupe national telephone poll, executed by Princeton Survey Research Associates International, conducted live interviews with 1003 adults on cell phones (501) and landlines (502) January 29-February 2, 2015. The poll's margin of error is +/-3.8%. Full poll results and methodology can be found here, including poll toplines (pdf) and crosstabs (xls).
The post Public vs. Private Employees On the Pension Crisis: Nobody Wants Responsibility appeared first on Reason.com.
]]>The new Reason-Rupe national telephone poll of 1,003 adults finds 72 percent of Americans are concerned their state and local governments may not be able to afford the pensions that have been promised to government workers. With those worries in mind, 82 percent favor requiring current public employees to contribute more towards their own future pensions and benefits.
A majority of Americans, 53 percent, believe public employees should contribute at least 50 percent of the cost of their retirement benefits. Fifty-eight percent of Americans favor setting a cap on the maximum dollar amount of annual pension payments public workers can receive during retirement, while 35 percent oppose a cap on pension payments.
Sixty-seven percent of Americans favor shifting future public employees, those who haven't been hired yet, from guaranteed defined-benefit pensions to 401(k)-style retirement accounts and 59 percent of Americans favor shifting current public employees to a 401(k)-style retirement system. However, only 38 percent of Americans support transitioning current public employees from guaranteed pensions to 401(k)-style retirement accounts if it means breaking a contract with existing workers. At the same time, 6 in 10 would favor such a transition if otherwise taxes would have to be raised or government services reduced.
Ultimately, sixty-six percent of Americans think shifting public employees from guaranteed pensions to 401(k)-style retirement accounts is a "good idea" because 401(k)-style accounts "give employees flexibility to take the plan with them from job to job and are less costly to taxpayers," while 29 percent say such a reform is a "bad idea" because "benefits would not be guaranteed and would depend on how well the employees and governments saved and how the market performs."
Trade-Offs in Pension Reform
Reason-Rupe posed a series of questions to gauge how Americans weigh specific aspects of the trade-offs that governments may be confronted with and it is clear Americans do not want to cut services or raise taxes to pay for public pensions.
Seventy-seven percent of Americans oppose reducing spending on services like education, health care and infrastructure so that the funding can be used to pay for public employee benefits at current levels. Similarly, 74 percent of Americans oppose raising property taxes, sales taxes or income taxes to fund a public pension shortfall.
But Americans don't want to cut current workers' or retirees' benefits, unless they have to. Seventy-one percent oppose reducing pension benefits that are currently being paid to already-retired public employees, while 27 percent favor a reduction in benefits to these retirees. Fifty-three percent of Americans oppose reducing current public employees' future pension benefits, while 44 percent favor reducing the pension benefits of current government employees who have not yet retired.
Nevertheless, when confronted with the hard choice of pension reforms or higher taxes, 81 percent of Americans say public employee contracts should be renegotiated to reduce pension benefits and current employees should contribute more to their own pensions, while 16 percent say taxes should be raised to fully fund public pensions at promised levels.
Likewise, when presented with the choice between cutting government services and pension reform, Americans choose the latter. Eight in 10 Americans favor renegotiating public employee contracts to reduce pension benefits and making current employees contribute more to their own pensions, while 15 percent favor reducing public services ranging from police and fire protection to recreation so that pensions can be maintained at current levels for past and present public employees.
Public Concern About Underfunded Pension Systems
Seventy-two percent of Americans are concerned that their local and state governments won't be able to fund public employee pensions as currently promised. Thirty-nine percent are "very concerned"; 33 percent are "somewhat concerned"; 15 percent of Americans are "not too concerned"; and 11 percent are "not concerned at all" about government's capacity to pay for public pensions.
Seventy-six percent of Americans think pension reform should be a priority for government: 35 percent say it should be a "top priority" and 41 percent say it should be an "important but lower priority."
Nearly three-quarters of Americans, 74 percent, are concerned their local or state governments will raise taxes in order to pay for public employee pension obligations in the future. Forty-two percent are "very concerned" and 32 percent are "somewhat concerned."
Despite the size of unfunded pension liabilities across the country, half of Americans say their local or state governments have not raised taxes or cut services nor have plans to do so to help pay for public pension costs. Roughly a quarter says their governments have raised taxes or reduced services or have plans to do so to help pay for pension costs, and another quarter say they don't know.
Public Employees Favorability and Benefits
Half, 50 percent, of Americans approve of the job President Barack Obama is doing, while 44 percent disapprove. Just 23 percent of Americans approve of the job Congress is doing, while 69 percent disapprove.
A majority, 54 percent, of Americans has a favorable view of public employees (24 percent have a "strongly favorable" view and 30 percent have a "somewhat favorable" view), while 28 percent have a "neutral" view of public workers, nine percent have a "somewhat unfavorable" view, and five percent have a "strongly negative" view.
Regarding the retirement benefits public employees receive, 52 percent of Americans believe public employees receive better benefits than private sector workers in similar jobs, while 24 percent think public and private-sector worker benefits are about the same, and 19 percent believe government workers have worse benefits of those in similar positions in the private sector.
A strong majority of Americans, 78 percent, believes the public should get to vote on any increases to public employee pensions, while 20 percent say the public should not get to vote.
Retirement and health care benefits are highly valued by Americans. When considering whether to take a new job or stay at their existing job, 30 percent of Americans say benefits such as health care and 401(k) savings are the most important factor, followed by how interesting the work is (20 percent), earning the highest pay possible (17 percent), making a difference in society (13 percent), a pension (nine percent), and a flexible work schedule (seven percent).
When asked to choose, 65 percent of Americans would rather take a job with a lower salary but more health and retirement benefits, while 33 percent would rather take a job with a higher salary but fewer health and retirement benefits.
Contact
Kristen Kelley, Communications Specialist, Reason Foundation, (443) 722-5592
The post Poll: 72 Percent of Americans Are Concerned About Public Pension Costs, 82 Percent Say Public Employees Should Contribute More to Their Own Retirement appeared first on Reason.com.
]]>The new Reason-Rupe national telephone poll of 1,003 adults finds 72 percent of Americans are concerned their state and local governments may not be able to afford the pensions that have been promised to government workers. With those worries in mind, 82 percent favor requiring current public employees to contribute more towards their own future pensions and benefits.
A majority of Americans, 53 percent, believe public employees should contribute at least 50 percent of the cost of their retirement benefits. Fifty-eight percent of Americans favor setting a cap on the maximum dollar amount of annual pension payments public workers can receive during retirement, while 35 percent oppose a cap on pension payments.
Sixty-seven percent of Americans favor shifting future public employees, those who haven't been hired yet, from guaranteed defined-benefit pensions to 401(k)-style retirement accounts and 59 percent of Americans favor shifting current public employees to a 401(k)-style retirement system. However, only 38 percent of Americans support transitioning current public employees from guaranteed pensions to 401(k)-style retirement accounts if it means breaking a contract with existing workers. At the same time, 6 in 10 would favor such a transition if otherwise taxes would have to be raised or government services reduced.
Ultimately, sixty-six percent of Americans think shifting public employees from guaranteed pensions to 401(k)-style retirement accounts is a "good idea" because 401(k)-style accounts "give employees flexibility to take the plan with them from job to job and are less costly to taxpayers," while 29 percent say such a reform is a "bad idea" because "benefits would not be guaranteed and would depend on how well the employees and governments saved and how the market performs."
Trade-Offs in Pension Reform
Reason-Rupe posed a series of questions to gauge how Americans weigh specific aspects of the trade-offs that governments may be confronted with and it is clear Americans do not want to cut services or raise taxes to pay for public pensions.
Seventy-seven percent of Americans oppose reducing spending on services like education, health care and infrastructure so that the funding can be used to pay for public employee benefits at current levels. Similarly, 74 percent of Americans oppose raising property taxes, sales taxes or income taxes to fund a public pension shortfall.
But Americans don't want to cut current workers' or retirees' benefits, unless they have to. Seventy-one percent oppose reducing pension benefits that are currently being paid to already-retired public employees, while 27 percent favor a reduction in benefits to these retirees. Fifty-three percent of Americans oppose reducing current public employees' future pension benefits, while 44 percent favor reducing the pension benefits of current government employees who have not yet retired.
Nevertheless, when confronted with the hard choice of pension reforms or higher taxes, 81 percent of Americans say public employee contracts should be renegotiated to reduce pension benefits and current employees should contribute more to their own pensions, while 16 percent say taxes should be raised to fully fund public pensions at promised levels.
Likewise, when presented with the choice between cutting government services and pension reform, Americans choose the latter. Eight in 10 Americans favor renegotiating public employee contracts to reduce pension benefits and making current employees contribute more to their own pensions, while 15 percent favor reducing public services ranging from police and fire protection to recreation so that pensions can be maintained at current levels for past and present public employees.
Public Concern About Underfunded Pension Systems
Seventy-two percent of Americans are concerned that their local and state governments won't be able to fund public employee pensions as currently promised. Thirty-nine percent are "very concerned"; 33 percent are "somewhat concerned"; 15 percent of Americans are "not too concerned"; and 11 percent are "not concerned at all" about government's capacity to pay for public pensions.
Seventy-six percent of Americans think pension reform should be a priority for government: 35 percent say it should be a "top priority" and 41 percent say it should be an "important but lower priority."
Nearly three-quarters of Americans, 74 percent, are concerned their local or state governments will raise taxes in order to pay for public employee pension obligations in the future. Forty-two percent are "very concerned" and 32 percent are "somewhat concerned."
Despite the size of unfunded pension liabilities across the country, half of Americans say their local or state governments have not raised taxes or cut services nor have plans to do so to help pay for public pension costs. Roughly a quarter says their governments have raised taxes or reduced services or have plans to do so to help pay for pension costs, and another quarter say they don't know.
Public Employees Favorability and Benefits
Half, 50 percent, of Americans approve of the job President Barack Obama is doing, while 44 percent disapprove. Just 23 percent of Americans approve of the job Congress is doing, while 69 percent disapprove.
A majority, 54 percent, of Americans has a favorable view of public employees (24 percent have a "strongly favorable" view and 30 percent have a "somewhat favorable" view), while 28 percent have a "neutral" view of public workers, nine percent have a "somewhat unfavorable" view, and five percent have a "strongly negative" view.
Regarding the retirement benefits public employees receive, 52 percent of Americans believe public employees receive better benefits than private sector workers in similar jobs, while 24 percent think public and private-sector worker benefits are about the same, and 19 percent believe government workers have worse benefits of those in similar positions in the private sector.
A strong majority of Americans, 78 percent, believes the public should get to vote on any increases to public employee pensions, while 20 percent say the public should not get to vote.
Retirement and health care benefits are highly valued by Americans. When considering whether to take a new job or stay at their existing job, 30 percent of Americans say benefits such as health care and 401(k) savings are the most important factor, followed by how interesting the work is (20 percent), earning the highest pay possible (17 percent), making a difference in society (13 percent), a pension (nine percent), and a flexible work schedule (seven percent).
When asked to choose, 65 percent of Americans would rather take a job with a lower salary but more health and retirement benefits, while 33 percent would rather take a job with a higher salary but fewer health and retirement benefits.
About the Reason-Rupe Poll
The full poll is available online at:
http://reason.com/poll/2015/02/06/february-2015-reason-rupe-pension-poll
Toplines
http://reason.com/assets/db/14231597715814.pdf
Cross Tabs
http://reason.com/assets/db/14231598897977.xlsx
Methodology
http://reason.com/assets/db/14231598612281.pdf
Questionnaire
http://reason.com/assets/db/14231598065741.pdf
The Reason-Rupe national telephone poll conducted live interviews with 1,003 adults on cell phones (501) and landlines (502) including 290 respondents without landlines, from January 29 through February 2, 2015. The poll's margin of sampling error is plus or minus 3.8 percent and was executed by Princeton Survey Research Associates International.
For more information and resources about the Reason-Rupe poll, please visit:
This is the latest in a series of Reason-Rupe public opinion surveys dedicated to exploring what Americans really think about government and major issues. This Reason Foundation project is made possible thanks to the generous support of the Arthur N. Rupe Foundation.
The post Poll: 72 Percent of Americans Are Concerned About Public Pension Costs, 82 Percent Say Public Employees Should Contribute More to Their Own Retirement appeared first on Reason.com.
]]>The American Idea posits that the choices we make shape individual success. However, the State can undermine this promise if its most powerful tool—its policing power—is misused or allows external characteristics to skew the application of justice. It's demoralizing and imposes a narrative of inferiority. Recent Reason-Rupe polling reveals Americans are significantly divided in their perception of abuse and bias in the criminal justice system and this perception divide alone ought to give us pause.
Irrespective of the actual extent of systemic bias, perception alone can be debilitating. The perception of a biased justice system may lead one to be less willing to give benefit of the doubt and to feel that self-determination is out of their grasp.
Compiling Reason-Rupe polling data finds dramatic racial differences in perceptions of law enforcement and the criminal justice system more generally. Minorities tend to believe the police too often use excessive force, that the cases of excessive force are on the rise, but also that police officers are not generally held accountable for their conduct.
Stark Perception Gap
Granted, majorities of all racial groups—80% white, 52% black, 51% Hispanic—say they have a favorable view of the police. However, black and Hispanic Americans (82% and 72% respectively) are far more likely to believe police are too quick to use lethal force, compared to 34 percent of white Americans. In contrast, a solid majority (59%) of white Americans believe the police only use lethal force when necessary, compared to 16 percent of black Americans and 23 percent of Hispanics.
Furthermore, both African-Americans and Hispanics feel that the number of excessive force cases is increasing—73% and 67% respectively—compared to 38 percent of Caucasians.
Not only that, but 67 percent of black and Hispanic Americans feel police officers are generally not held accountable for misconduct, compared to only 37 percent of white Americans. Notice, the wording did not say "occasionally" but "generally". Minorities tend to view lack of police accountability as the rule, not the exception. Conversely, a solid majority of Caucasians (58%) says officers are held accountable before the law, compared to a third of nonwhite Americans.
Perhaps most troubling for any Republic committed to the rule of law, is that nonwhite Americans perceive the criminal justice system to treat white Americans more fairly. While 53 percent of Caucasians believe the system treats all racial groups the same, 83 percent of African-Americans and 62 percent of Hispanics say Caucasians are treated more fairly under the law.
Reality Check
Why the perception difference? There is empirical evidence that does reveal racial bias in the application of justice.
For instance, in Ferguson, MO even though white residents are more likely to be caught with contraband, black Ferguson residents disproportionately comprise 86 percent of all traffic stops and 92 of all arrests despite representing 67 percent of the community. The Missouri Attorney General's Office's 2013 racial profiling report found 1 in 3 white Ferguson residents who were stopped and searched were caught with contraband compared only 1 in 5 black residents who were stopped and searched.
Moreover, a 2010 ACLU report found that although white and black Americans use marijuana at equal rates, African-Americans are nearly 4 times as likely to be arrested for marijuana possession.
Implications
Instead of drawing lines and labeling others as whiners/complainers or racists, we should take a moment to consider the possibility that no particular side has a complete monopoly on reality.
Part of the problem is that most individuals have difficulty understanding the experiences of others, particularly those outside of their social orbits. For instance, an ABC/Washington Post survey found that nearly two thirds of both white and Hispanic Americans did not believe black Americans in their communities experience racial discrimination. Yet the results are completely flipped for black Americans: nearly two-thirds say blacks in their communities do experience discrimination. This includes 33 percent who say it occurs "often" and 29 percent who say "occasionally" or "rarely."
Further complicating the perception divide is the relative group sizes. Suppose you have at least two groups: one of which comprises the majority and sees little problem but the other group is a minority and says there is a problem. Who might you be more inclined to believe? Personally, I'm inclined to believe both sides probably report what they genuinely observe in their own lives.
Nevertheless, James Madison's warning in Federalist #10 of tyranny of the majority should prompt us to pay careful attention to the perceptions of the minority:
"Complaints are everywhere heard from our most considerate and virtuous citizens, equally the friends of public and private faith, and of public and personal liberty, that our governments are too unstable, that the public good is disregarded in the conflicts of rival parties, and that measures are too often decided, not according to the rules of justice and the rights of the minor party, but by the superior force of an interested and overbearing majority.
…When a majority is included in a faction, the form of popular government…enables it to sacrifice to its ruling passion or interest both the public good and the rights of other citizens." [Emphasis added]
The fact that white Americans are the majority and don't perceive much of a problem in the criminal justice system necessarily means most elected officials don't perceive a problems and thus don't pursue reform.
For instance, in the United States, the average member of Congress in 2014 is 57 years old, college educated, male, and Caucasian. As I explain in an earlier post, using a statistical technique we can predict the likelihood this average member of Congress perceives bias in the criminal justice system. Such a test found there is a 65% chance the average member of Congress does not think there is racial bias in the system. Without perceiving a problem, there is little reason to expect them to pursue reform.
And this speaks to the core of why so many Ferguson protestors are justifiably upset. It reasonably appears that in the midst of unarmed black men—or any unarmed suspects for that matter—being shot and killed by those entrusted with their protection, law enforcement officials are rarely held accountable. Not only that, but elected officials don't seem to believe there is even a problem. This naturally leads many to conclude those in power do not believe them or worse—even care about them.
As Ronnie Natch a peaceful Ferguson protestor put it: "This was a chance to vent about the national treatment of black men across the country… We want to show up at the front door every day and say, through words, that this shooting is not going to be swept under the rug …There have just been too many deaths."
All lives matter. Until we can genuinely attempt to understand the experiences of others—rather than label those with whom we disagree as complainers, Marxists, or racists—we cannot move forward.
* Contraband Hit Rate=(Searches with Contraband Found/Total Searches) X 100
The post Why We Should Care About the Racial Divide in Perceptions of Law Enforcement appeared first on Reason.com.
]]>The post Polling Finds a Stark Racial Divide in Perceptions of Law Enforcement appeared first on Reason.com.
]]>Police officers keep claiming that they genuinely thought their unarmed victims had lethal weapons. Ferguson police officer Darren Wilson, who shot unarmed black teenager Michael Brown, claims in his grand jury testimony that Brown put his right hand "under his shirt in his waistband" and then lunged at him—153 feet away. Yet Michael Brown did not have a gun. Instead he was shot 7 times, with the last shot being lethal.
Just last Monday, Ohio police officers shot Tamir Rice, a twelve-year old African-American child, because they thought his fake "airsoft"-type pellet gun was an actual gun. In August, Ohio police officers gunned down an unarmed African-American customer in a Wal-mart talking on his cell phone who had picked up a pellet gun, out of its package, that was sitting on the shelf. The special prosecutor, who argued the case in front of a grand jury who did not indict any police officer, tried to explain at a later press conference:
"The law says police officers are judged by what is in their mind at the time…You have to put yourself in their shoes at that time with the information they had."
Academic research, however, tells us that more than a police officer's conscious intentions may influence their judgments and actions. University of North Carolina psychologist Keith Payne (2001) conducted an experiment finding research participants were more likely to mis-identify a hand tool as a gun when they had to respond quickly, immediately after being shown the face of an African-American male rather than a Caucasian male. Particularly, white and male respondents were faster to identify guns when "primed" with a black face versus a white face.
This suggests that police officers like Daren Wilson may have genuinely believed their lives were threatened, and acted accordingly—but that their conclusions were unduly and implicitly influenced by their own stereotypes.
But there is hope. Payne also found that an individual's personal desire to overcome prejudice—to not feel it or express it—moderated the effect of racial bias on categorizing tools or guns. For instance, those who were more likely to agree with statements like, "I get angry with myself when I have a thought or feeling that might be considered prejudiced," or "It's never acceptable to express one's prejudices" were significantly less likely to implicitly allow their own stereotypes to influence their performance in the experiment.
This chart is probably one of the most hopeful findings of social science research: we as individuals can make choices that reduce the effect of prejudices or stereotypes we may hold. The horizontal axis of the chart measures an individual's implicit racial prejudices and the vertical axis essentially measures the effect of racial bias exhibited during the experiment. The three plotted lines represent different levels of desire to suppress one's prejudices. The solid black line shows that among those who had high desire to overcome their prejudice, their implicit racial stereotypes did not affect their experiment performance. However, the small dotted line shows that for those who cared little about their own prejudice, their racial stereotypes significantly and substantially affected their behavior in the experiment.
This chart quickly summed up is this: One's personal desire to overcome prejudice can significantly and meaningfully moderate the effect of subconscious stereotypes and the (perhaps unintended) harms they may cause.
This has implications for society generally and also law enforcement specifically. Police officers are often in situations where they must make quick judgments in a stressful environment. Payne's research suggests that even police officers intending to be fair may allow their subconscious stereotypes to influence their judgments unless they make a concerted effort to care about overcoming such prejudices.
(Charts from B. Keith Payne. (2001). Prejudice and perception: The role of automatic and controlled processes in misperceiving a weapon. Journal of Personality and Social Psychology, 81(2), 181-192. Figure 3 legend and vertical axis label revised for reader clarity.)
The post Why Police Officers Keep Claiming Their Unarmed Victims Had Guns, and What We Can Do About It appeared first on Reason.com.
]]>Odd things happen when third party candidates enter a competitive race. Examining Alaska, Florida, and Maine we find tea party favorite and former Alaska Gov. Sarah Palin endorsing a Democrat and Independent, tea party-backed candidates courting the support of so-called establishment Republicans, Democrats supporting a social conservative and Republicans nearly criticizing them for doing so.
Here are the key governor races with influential third party candidates to watch tomorrow:
Alaska
The Alaska governor's race has taken an unconventional turn with Democratic candidate Bryon Mallott dropping out to the race to form a "unity ticket" with socially conservative Independent candidate Bill Walker, Democrats then supporting a social conservative, and Republicans criticizing them for it.
The incumbent Republican governor Sean Parnell was the expected front-runner until the third-party candidate teamed up with the Democrat. Parnell has also had difficulty with voters for several reasons. First, as governor he has run up deficits, dipped into the state reserves, refused to accept Medicaid expansion, and some believe he has mishandled the Alaska National Guard sexual assault case. In addition, voters perceive Parnell to have doled out special favors to oil and gas special interests, leading former Republican Gov. Sarah Palin to endorse the Walker-Mallott ticket saying Republican Parnell was "suckered" by "crony capitalists." The political dynamics of the race are all over the board. Along with Sarah Palin's endorsement, Walker-Mallott also received the AFL-CIO's endorsement.
Independent Bill Walker used to be a Republican, remains socially conservative, and is a deficit hawk promising to cut spending and raise taxes on somebody to balance the budget. So this put Democrats in a curious position of supporting a social conservative in order to break into Alaska's Republican-dominated state house. Moreover, Republicans find themselves walking the fine line of pointing out Walker's stances on abortion and gay marriage to Democrats without offending socially conservative Parnell voters.
Florida
In Florida a former and current governor are in a tight race tomorrow, with enough irritated voters that the libertarian candidate pulls about 7 percent of the likely vote. Polls show former governor Republican-turned-Democrat Charlie Crist with an average of 42 percent of the vote, incumbent Republican Rick Scott with 41.2 percent and libertarian candidate Adrian Wyllie with 7 percent.
Voters are disillusioned with both candidates, perhaps because neither can claim outsider status having both filled the office before. Moreover, both Scott and Crist are underwater on their favorables (Scott 48 to 41, Crist 47 to 40). Consequently, the race has considerably more undecided voters than usual. Political Science Professor Susan MacManus argues that ultimately voters will decide the Florida governor's race based not on whom they like, but whom they dislike less.
While undecided voters and independents tend to tilt toward Crist in this race, libertarian candidate Wyllie pulls voters from both Crist and Scott, although slightly more from Scott. For instance, a St. Leo University poll finds Crist with 43 percent, Scott with 40 percent, and Adrian Wyllie with 8 percent. However, if no libertarian candidate were in the race, Scott would receive a 5-point bump and Crist a 2-point bump, tying at 45 percent each. Interestingly, while Scott struggles with a major gender gap (35% to Crist's 50%) men and women are equally likely to support the libertarian (about 7%). White and Hispanic Americans are also equally likely to support the libertarian (9 percent). Young people (14%) are twice as likely as those over 40 (7%) to favor Wyllie. However, with Wyllie out of the race, most of these younger voters choose Scott over Crist.
Rick Scott was initially swept into power riding the 2010 tea party wave, and has managed to keep grassroots conservatives only marginally pleased with his tenure. In contrast to the several toss up senate races, Scott has not enlisted the help of tea party favorites like Sen. Ted Cruz and former Alaska Gov. Sarah Palin. Instead, he has sought the support of Louisiana Gov. Bobby Jindal, New Jersey Gov. Chris Christie, former Florida Gov. Jeb Bush, and Texas Gov. Rick Perry, indicating he's trying to reach more moderate voters.
Charlie Crist has sought the help of Vice President Joe Biden on the campaign trail, and Rev. Al Sharpton and Rev. Jesse Jackson signaling his attempt to turn out more left-of-center voters.
Maine
Unlike most other races with third-party candidates, Maine's independent candidate Eliot Cutler is siphoning off votes primarily from Democratic Rep. Mike Michaud, who is in an extremely tight race with Republican incumbent Paul LePage. Real Clear Politics shows LePage with an average of 41.2 percent, Michaud with 39.8 percent, and Cutler with 12.3 percent.
Rather than having distinct issue positions, Cutler's views tend to align with the Democratic candidate Michaud, however he's proven himself a formidable campaigner and debater. Cutler is socially liberal, supports universal health care and college education, campaign finance reform, and repealing "outdated" regulations. Indeed, polls have found that on average, 64 percent of Cutler voters would pick Michaud as their second choice, and 36 percent would pick LaPage.
In efforts to win back some of these potential Michaud voters, Maine Democrats have sought to point out how Cutler is not liberal enough on public sector unions, taxes, the minimum wage, and criticized him for calling free college tuition a "gift." Michaud has brought in Democratic heavy weights, such as President Bill Clinton as well as President Barack Obama and Michelle Obama in order to court Cutler voters.
Without gaining serious traction in the polls, Cutler held a press conference last week telling his supporters to vote for someone else if they don't think he can win. This prompted Independent Sen. Angus King to shift his support to Democratic candidate Michaud.
Key Takeaway
Third party candidates in tight governors races reveal that such candidates can peel off voters from both Democratic and Republican mainstream candidates. In the last minute scramble to pick up swing voters and re-capture third party voters, partisan activists resort to crossing party lines and positions in efforts to win.
The post Independent Candidates Shake Up 2014 Governor Races appeared first on Reason.com.
]]>To take control of the Senate this November, Republicans need a net gain of six Senate seats to take control of Congress, but third party candidates in North Carolina, Kansas, South Dakota, Georgia, (and sort of Louisiana) may undermine this goal.
In North Carolina, a libertarian pizza deliveryman could determine the race between Kay Hagan and Thom Tillis. An independent in Kansas is leading the Republican incumbent Pat Roberts in many recent polls, also with a libertarian who could influence the outcome. An independent in South Dakota has introduced uncertainty in what should have been considered an "in the bag" seat for Republicans. A libertarian and tea partier could force both Louisiana and Georgia into a run-off election. Strikingly in Virginia, the Libertarian candidate is capturing more votes than the Republican among young voters.
While it is true third-party candidates typically don't win, serious third party challengers can still identify the major parties' vulnerabilities based on which types of voters they peel away.
For instance, as Sen. John Cornyn (R-TX) explained, "If people don't like their choices with the Republican candidate or the Democratic candidate, then you're going to see a spurt in third-party candidates, so they can definitely affect outcomes."
Examining third-party influence across the country reveal the pivotal voters tend to exhibit similar patterns: Independents who lean right although sometimes left, often with a libertarian streak, were disillusioned during the GOP primary by establishment candidates earlier this year, and now are less enthusiastic about supporting the major party candidate.
Here are some of the races we examined:
North Carolina Senate
In North Carolina, incumbent Democrat Kay Hagan is in a bitter fight with Republican Thom Tillis, each pulling 44 percent of the vote. The tight race means that libertarian Sean Haugh garnering 5 percent of the vote among likely voters could impact which party wins the seat. Even if only a portion of his supporters show up, they could influence an election this close.
Recent shifts in public opinion combined with Hagan's support of the Affordable Care Act/Obamacare had made the North Carolina incumbent vulnerable. Consequently, some observers view libertarian Sean Haugh as part of the reason Republican Thom Tillis isn't leading in the polls. Demonstrating the lopsided enthusiasm, an NBC/Marist poll finds 7 in 10 Kay Hagan supporters "strongly" support her, while only 54 percent of Tillis' can say the same. While a plurality of likely voters (48 percent) say they'd rather vote for a Republican than a Democrat (43 percent) for Congress, this hasn't translated into stronger support for Tillis.
There are several reasons Thom Tillis is scrambling in the final days of the election. First, many grassroots tea party groups and Republicans in the area remain disillusioned since the GOP primary earlier this year when tea party favorite Greg Bannon lost to Tillis. Bannon had appealed to independent-minded libertarian voters in the area, but Tillis has thus far failed to gin up their enthusiasm.
Tea party groups also remain unimpressed with Tillis' candidacy viewing him as not sufficiently fiscally conservative and a "corporatist" who uses government to give special favors to interest groups. Insiders do tend to get this reputation.
Moreover, libertarian Sean Haugh had once registered as a Republican to vote for Ron Paul in 2008, which further bolsters his credentials among a small but very active group of Paul supporters.
Although Sen. Rand Paul (R-KY) had previously endorsed Tillis' primary opponent, they have since teamed up on the campaign trail. The fact that Tillis sought out Paul's support provides further indication of what types of potential voters he's most concerned about losing: libertarian leaning, independent-minded voters.
Tea party groups are divided over whether to support Tillis for the hope of taking back the Senate—which they call "clothespin support"—or withholding their support for a RINO republican. By clothespin support, they mean holding their noses as they support a candidate whom they view as the better of two bad options.
Kansas Senate
In Kansas the Republican, veteran incumbent Pat Roberts, has found himself in an unexpected and unusual position of potentially losing to an independent. After Democratic candidate Chad Taylor dropped out of the race, Roberts found himself once again in two-way race but trailing or barely tying with independent candidate Greg Orman. SurveyUSA, which has a successful history of polling Kansas voters, finds Orman at 44 percent and Roberts at 42 percent. Further complicating the race, libertarian candidate Randal Batson is garnering 4 percent of the vote. In a close race like this, the libertarian could again influence who wins.
Similar to North Carolina, grassroots tea party groups and Republicans remain bitter over the GOP primary earlier this year when Roberts defeated their favored candidate Milton Wolf in a closer than expected outcome, 48 to 41 percent. In contrast, Republican Governor Sam Brownback garnered 63 percent of the primary vote.
A significant number of likely Republican voters simply aren't excited about 3-term Senator Pat Roberts for several reasons. Like Tillis, they view Roberts as a so-called establishment Republican who gives special favors to interest groups and compromised principles by voting to raise the debt ceiling. The primary also ginned up anger over Roberts not actually having a residence in Kansas, but rather being a full-time creature of Washington DC.
Interestingly, Politico reported Milton Wolf, who purportedly ran to the "right" of Roberts, considered endorsing independent Greg Orman, to the "left" of Roberts. This shows the issues that matter in this race are more than just right and left. However, since Orman would not promise to caucus with Republicans, Wolf did not endorse Orman. Instead, in a surprising turn, Wolf took one for the Red team and endorsed Roberts.
Shedding light on the types of voters Roberts is having trouble courting, Roberts has also enlisted the support of Sen. Rand Paul, and Sen. Ted Cruz (R-TX), another tea party backed candidate, as well as Sarah Palin. This further demonstrates Roberts' weakness among tea party conservatives.
While Greg Orman has been both a Republican and a Democrat, he refuses to promise which party he'd caucus with if elected. However, the fact that FEC records show he's sent 87 percent of his contributions to Democrats may explain why national tea party groups have formally shifted their support to Roberts. Both Tea Party Patriots Citizens Fund and Tea Party Express are actively campaigning for Roberts and trying to mobilize disillusioned voters.
Georgia Senate
In Georgia's open senate race, Republican David Purdue is essentially tied with Democrat Michelle Nunn. Real Clear Politics puts the averages at 45.8 for Perdue and 45.3 for Nunn. Consequently, libertarian candidate Amanda Swafford's 4 percent could prevent either major candidate from reaching Georgia's 50 percent threshold, forcing a run-off.
In July of this year, Election Lab forecasts gave Perdue a 98 percent chance of winning in July. Why isn't he doing better? The story is similar to Kansas and North Carolina, after a bruising GOP primary, David Perdue has struggled to regain support from grassroots conservatives he turned off during the primary.
Georgia's primary race was much messier than other states. In the initial five-way primary race, Grassroots tea Party support was split between former Georgia Sec of State Karen Handel (who received Sarah Palin's endorsement), Rep. Paul Broun (R-GA), and Rep. Phil Gingry (R-GA). Business conservatives alternatively preferred political outsider and former CEO David Purdue, and Rep. Jack Kingston (R-GA). When only Purdue and Kingston proceeded to the run-off, grassroots conservatives threw their support toward Kingston. In fact, Kingston has been shifting more conservative in his voting record since the tea party emerged and emphasized his own personal thrift. However, grassroots conservatives lost again as Perdue defeated Kingston in the run-off.
One may have thought Perdue being a political outsider could have bridged the gap between the different Republican factions. However, he got into trouble with the grassroots when he supported both spending cuts and revenue increases, which tea partiers took to mean tax hikes. Perdue has since clarified he meant growing the economy rather than tax increases.
Once again, the establishment-favored candidate, Perdue, has sought the help of Sen. Rand Paul in efforts to build credibility with libertarian-leaning and tea party type voters while also holding onto his moderate base of support. Similar to Kansas, national tea party groups like Tea Party Patriots Citizens Fund have since endorsed Perdue fearing Democratic control of the Senate.
Louisiana Senate
Louisiana uses a "jungle primary" to select their Senator requiring the winner to exceed a 50 percent threshold, like Georgia. However, the latest USA Today/Suffolk poll found Democrat Mary Landrieu with 36 percent, Republican Bill Cassidy with 35 and tea party-backed Rob Maness with 11 percent. While not a third party candidate, the presence of Maness prevents Cassidy from any hope of reaching a 50 percent threshold, almost guaranteeing a run-off with the top two candidates in December.
Cassidy cannot point to a bitter GOP primary fight to explain muted grassroots enthusiasm for his candidacy. Even though he joined the Congressional Tea party Caucus he has had trouble gaining traction among grassroots conservatives, and tea party express (a national affiliate) and Sarah Palin endorsed Maness. Part of his difficulties stem from the fact that grassroots don't view him as authentically fiscally conservative—for instance he vocally supported TARP and then changed his position 2010. On top of that Cassidy previously donated to Mary Landrieu in 2002 and criticized Republican Gov. Bobby Jindal. Maness is also carving out space further right on immigration.
South Dakota Senate
In South Dakota, both independent leaning Democratic and Republican voters are upsetting what was expected to be a smooth election. The latest Rasmussen survey finds Rounds with 45 percent, his Democratic opponent Rick Weiland with 31 percent, and independent Larry Pressler with 21 percent.
When Democratic incumbent Tim Johnson retired this year, both Republicans and Democrats were hopeful to fill the seat. However, without strong Democratic candidates taking the initiative to run, observers expected former Gov. Mike Rounds to take the seat. However, Rounds became embroiled in an immigrant investment scandal that could potentially result in his indictment.
Now enters independent candidate Larry Pressler. This third-party candidate actually once held this very seat, but as a Republican. However, he refuses to sign a pledge not to raise additional taxes, supports the Affordable Care Act, and supported Barack Obama in 2008. Nevertheless, his reasoning might resonate with libertarians as well:
"Part of my reason for supporting Obama—it was for conservative reasons…It's been Republican presidents and Republican congresses who've added more to the deficit, and Democrats who've added less to the deficit."
As evidenced by the aforementioned quote, Pressler is also a fiscal hawk with an eye to reforming entitlements and raising the retirement age.
With this mixed bag approach to politics, it's little surprise he could pick off both independent-minded Democratic and Republican voters. In fact, Rick Weiland complained that outside groups attacking his Republican opponent were actually helping the independent Pressler over Weiland the Democrat.
Republican Mike Rounds has also created further problems for himself by failing to energize conservative grassroots support. Many likely Republican voters are turned off by the fact that he supported TARP, the stimulus, the Medicare Part D expansion, and proposing paying down the state deficit with reserves rather than actually cutting spending. Local tea party groups who would otherwise endorse candidates have refused to lend Rounds their support. President of the South Dakota Citizens for Liberty group explained at a local event, "[Mike Rounds] likes to build government and likes to spend money."
Implications
Across these key races, third party candidates undermine the traditional support enjoyed by the two major party candidates. They point out weakness and vulnerabilities, and tend to reveal a similar pattern. Independents, both left and right leaning, but particularly right leaning, libertarians, and tea partiers are at the highest risk of "defection" from casting a traditional partisan ballot.
The fact that the most vulnerable Republican candidates have enlisted the help of Sen. Rand Paul demonstrates the types of voters they are having the greatest difficulty connecting with—the liberty-minded, small government libertarians and conservatives.
So-called "Establishment Republicans" have had difficulty convincing their potential voters they are sufficiently fiscally conservative and principled such that they won't dole out special favors to Wall Street, K Street, or even Main Street once they are elected. It may be that Rand Paul's unique brand of liberty-minded small government conservatism is one of the missing ingredients.
The post Midterm 2014 Guide: Third-Party Senate Candidates Give Establishment Republicans Conniptions appeared first on Reason.com.
]]>Americans like the police, but older, more affluent, white, conservative Republicans really like the police. Fully 72 percent of Americans say they have a favorable view of the police, and 24 percent have an unfavorable view, according to the latest Reason-Rupe poll. However, favorability has declined 6 points since the question was asked in April earlier this year. It's possible greater public awareness of police militarization in the aftermath of the Ferguson, MO protests has undermined public confidence.
While majorities of Americans have a favorable opinion of the police, intensity of support varies widely across groups. Most striking are differences across race/ethnicity.
Fully 80 percent of white Americans have a positive view of the police, with 43 percent who are very favorable. However only 52 percent of black and Hispanic Americans share this favorable view, and only 2 in 10 have a strongly favorable opinion of the police. Forty-three percent of African-Americans and 46 percent of Latinos have an unfavorable view of the police, compared to 17 percent of Caucasians.
Democrats (66%) and independents (60%) are also considerably less favorable of the police compared to Republicans (85%). However, different racial compositions within the political parties explain part of the difference. Only 55 percent of nonwhite Democrats like the police, compared to 75 percent of white Democrats, and 86 percent of white Republicans.
While liberals tend to be more distrustful of the police than conservatives—fiscal conservatives are themselves divided. Using the Reason-Rupe typology, social conservatives (51%) are more likely than libertarians (41%) to have a strongly favorable view. Only 30 percent of liberals and 35 percent of communitarians share conservatives' strongly favorable attitudes toward the police.
Older and wealthier Americans are also more likely to like the police. For instance, 83 percent of seniors are very favorable toward the police, and fully 50 percent are very favorable. In contrast, 60 percent of 18-29 years are favorable, and 30 percent are very favorable. Similarly by income, 83 percent of households making more than $90,000 a year have a favorable view, including 47 percent with a strongly favorable opinion. However, considerably fewer (65%) among those making less than $45,000 annually share a favorable view of the police, including only 30 percent with a strongly favorable view.
A standard statistical procedure to simultaneously account for basic demographic characteristics finds that being Caucasian, higher income, and from the South are the strongest statistically significant predictors of support for the police, followed by being a Republican, and a woman.
As to be expected, those who have a favorable view of police officers are most likely to think officers are generally held accountable for misconduct (61%), only use lethal force when necessary (59%), and believe the criminal justice system is fair to all races (51%). Conversely, those with a negative view of the police are far less likely to believe police officers are held accountable (22%), use lethal force only when necessary (22%), and say the justice system lacks racial bias (26%).
The Reason-Rupe national telephone poll, executed by Princeton Survey Research Associates International, conducted live interviews with 1004 adults on cell phones (503) and landlines (501) October 1-6, 2014. The poll's margin of error is +/-3.8%. Full poll results can be found here including poll toplines (pdf) and crosstabs (xls).
The post Who Really Likes the Police? Older, Richer, White, Conservative Republicans. appeared first on Reason.com.
]]>Americans like the police, but older, more affluent, white, conservative Republicans really like the police. Fully 72 percent of Americans say they have a favorable view of the police, and 24 percent have an unfavorable view, according to the latest Reason-Rupe poll. However, favorability has declined 6 points since the question was asked in April earlier this year. It's possible greater public awareness of police militarization in the aftermath of the Ferguson, MO protests has undermined public confidence.
While majorities of Americans have a favorable opinion of the police, intensity of support varies widely across groups. Most striking are differences across race/ethnicity.
Fully 80 percent of white Americans have a positive view of the police, with 43 percent who are veryfavorable. However only 52 percent of black and Hispanic Americans share this favorable view, and only 2 in 10 have a strongly favorable opinion of the police. Forty-three percent of African-Americans and 46 percent of Latinos have an unfavorable view of the police, compared to 17 percent of Caucasians.
Democrats (66%) and independents (60%) are also considerably less favorable of the police compared to Republicans (85%). However, different racial compositions within the political parties explain part of the difference. Only 55 percent of nonwhite Democrats like the police, compared to 75 percent of white Democrats, and 86 percent of white Republicans.
While liberals tend to be more distrustful of the police than conservatives—fiscal conservatives are themselves divided. Using the Reason-Rupe typology, social conservatives (51%) are more likely than libertarians (41%) to have a strongly favorable view. Only 30 percent of liberals and 35 percent of communitarians share conservatives' strongly favorable attitudes toward the police.
Older and wealthier Americans are also more likely to like the police. For instance, 83 percent of seniors are very favorable toward the police, and fully 50 percent are very favorable. In contrast, 60 percent of 18-29 years are favorable, and 30 percent are very favorable. Similarly by income, 83 percent of households making more than $90,000 a year have a favorable view, including 47 percent with a strongly favorable opinion. However, considerably fewer (65%) among those making less than $45,000 annually share a favorable view of the police, including only 30 percent with a strongly favorable view.
A standard statistical procedure to simultaneously account for basic demographic characteristics finds that being Caucasian, higher income, and from the South are the strongest statistically significant predictors of support for the police, followed by being a Republican, and a woman.
As to be expected, those who have a favorable view of police officers are most likely to think officers are generally held accountable for misconduct (61%), only use lethal force when necessary (59%), and believe the criminal justice system is fair to all races (51%). Conversely, those with a negative view of the police are far less likely to believe police officers are held accountable (22%), use lethal force only when necessary (22%), and say the justice system lacks racial bias (26%).
The Reason-Rupe national telephone poll, executed by Princeton Survey Research Associates International, conducted live interviews with 1004 adults on cell phones (503) and landlines (501) October 1-6, 2014. The poll's margin of error is +/-3.8%. Full poll results can be found here including poll toplines (pdf) and crosstabs (xls).
The post Who Really Likes the Police? Older, Richer, White, Conservative Republicans. appeared first on Reason.com.
]]>Senators Cory Booker (D-NJ) and Rand Paul (R-KY) have teamed up this year to introduce several bills aimed at reforming the nation's criminal justice system. The latest Reason-Rupe poll finds Americans are receptive to several of the proposed reforms.
77% Favor Eliminate Mandatory Minimums for Nonviolent Offenders
The latest Reason-Rupe poll finds that 77 percent of Americans favor eliminating mandatory minimum prison sentences so that judges have the ability to make sentencing decisions on a case-by-case basis. Seventeen percent oppose this policy change, and 6 percent don't have an opinion.
Support for eliminating mandatory minimums has increased 6 points since the poll first asked this question in December 2013.
Returning sentencing discretion to judges is popular across partisanship, race, age, income, and education. For instance, 81 percent of Democrats support eliminating mandatory minimums, as do 75 percent of independents and 73 percent of Republicans, including 69 percent of tea party supporters. Similarly, 77 percent of white Americans, 80 percent of African-Americans, and 73 percent of Hispanics favor eliminating mandatory minimum prison sentences for nonviolent offenders.
73% of Americans Support Restoring Voting Rights
Americans also support restoring voting rights to nonviolent drug offenders who have served their sentences by a margin of 73 to 24 percent.
Restoring voting rights is also widely popular across demographic groups, although Democrats are more supportive. Eighty-one percent of Democrats favor allowing nonviolent drug offenders who have served their sentences to vote and 17 percent oppose. In contrast, 66 percent of non-partisan independents and 64 percent of Republicans agree; 28 and 32 percent oppose, respectively.
Solid majorities across race/ethnic groups agree, but to different degrees. Fully 91 percent of African-Americans support restoring voting rights, compared to 66 percent of Hispanics and 72 percent of Caucasians.
Americans Sharply Divided Over Sealing Court Records
Americans are sharply divided on whether to allow nonviolent drug offenders to petition a court to have their records sealed once they've served their sentences, making them inaccessible to the public without a court order, with 47 percent in favor and 48 percent opposed.
Significant partisan and demographic differences emerge on allowing nonviolent drug offenders to petition a court to have their court records sealed.
Slim majorities of Democrats (53%) and non-partisan Independents (51%) support this reform, but a majority of Republicans oppose (59%). Notably, tea party supporters are no more likely to oppose (54%) than regular Republicans.
White Americans oppose allowing nonviolent drug offenders to petition a court to have their court records sealed by a margin of 53 to 43 percent. Conversely, a majority of black (56%) and Hispanic (64%) Americans favor this reform, while only a third oppose.
Men are slightly more likely to favor than women: 51 percent of men favor, 43 percent oppose; inversely, 43 percent of women favor and 53 percent oppose.
The two youngest generations, Generation X and the Millennials support allowing court records to be sealed, while the two older generations—the Baby Boomers and Silent Generation—oppose. In fact 57 percent of Americans under 45 favor allowing nonviolent drug offenders to petition to have their records sealed and 39 percent oppose. However, by age 45, majorities of Americans begin to oppose this type of reform: 57 percent oppose and 38 percent favor.
Notably, majorities of both white and nonwhite Americans under 45 support this reform (54 and 59 percent respectively). Only white Americans over 45 oppose allowing court records to be sealed, 61 to 36 percent. Older nonwhite Americans are evenly divided at 46 percent.
Politicians may find criminal justice reform to be a winning issue for them going forward for two primary reasons. First, support is relatively stable within age cohorts, meaning that younger Americans support criminal justice reform and will likely continue to do so even as they age. Second, racial differences largely disappear across young white and nonwhite Americans, meaning that support for reform is broadly popular.
More from Reason's Lauren Galik on criminal justice reform, Annual Privatization Report 2014, Criminal Justice and Corrections.
The Reason-Rupe national telephone poll, executed by Princeton Survey Research Associates International, conducted live interviews with 1004 adults on cell phones (503) and landlines (501) October 1-6, 2014. The poll's margin of error is +/-3.8%. Full poll results can be found here including poll toplines (pdf) and crosstabs (xls).
The post Poll: 77% of Americans Favor Eliminating Mandatory Minimum Prison Sentences For Nonviolent Offenders; 73% Favor Restoring Voting Rights appeared first on Reason.com.
]]>While 73 percent of Americans say most members of Congress do not deserve to be reelected this November, Reason-Rupe finds that 53 percent are yet still satisfied with the candidates running for Congress in their own districts. However, only 9 percent report being "very satisfied" while 44 percent are "somewhat satisfied." Thirty-four percent are unsatisfied (20% somewhat, 14% very), while 12 percent don't have an opinion.
In keeping with America's federalist tradition, Americans are more supportive of candidates closer to home. Fifty-seven percent say they are satisfied with candidates for state level offices, and a third are dissatisfied. Slightly more, 62 percent, are satisfied with candidates for local level offices, and a quarter are dissatisfied.
Strong Democratic (60%) and Republican (56%) partisan voters are about equally likely to report satisfaction for their districts' House and Senate candidates for the upcoming midterm elections. Only 3 in 10 report dissatisfaction with state-level candidates.
However, independent and independent-leaning Republican voters are least likely to be happy with candidates running in their districts. Instead, 53 percent of non-partisan independents and 48 percent of independent-leaning Republican voters say they are dissatisfied with the House and Senate candidates running in their districts. Independent-leaning Democrats are similar to strong Democrats with only 30 percent dissatisfied.
Similarly at the state-level, pluralities of Independents and independent leaning-Republicans are dissatisfied (roughly 46%) with state level candidate options, while about 4 in 10 are satisfied. Conversely, majorities (6 in 10) of strong partisans are satisfied with state-level candidate choices, and 27 percent are dissatisfied.
Independents are more supportive of local-level candidates. Both partisan and independent leaners are satisfied with candidates for local level offices—roughly 60 to 70 percent. About a quarter are dissatisfied.
Only at the local level do a plurality (48%) of non-partisan independents report satisfaction with candidate options, with a third dissatisfied.
Taking a closer look at who these dissatisfied voters are reveals they tend to come disproportionately from independent and independent-leaning Republican voters, are more male (57%), and are more likely to favor smaller government and free market solutions to complex economic problems.
These results comport with oft-found survey results that Americans dislike Congress but like their own member of Congress. They also demonstrate that candidates running closer to home receive higher marks than federal-level candidates.
These data also suggest that Republican candidates must deal with more unpredictable voters, as independent-leaning Republicans are considerably less happy with their candidates than independent-leaning Democrats and partisan voters.
The Reason-Rupe national telephone poll, executed by Princeton Survey Research Associates International, conducted live interviews with 1004 adults on cell phones (503) and landlines (501) October 1-6, 2014. The poll's margin of error is +/-3.8%. Full poll results can be found here including poll toplines (pdf) and crosstabs (xls).
The post Poll: 53% of Americans Satisfied with House and Senate Candidates; Independent and Independent-Leaning Republicans Least Satisfied appeared first on Reason.com.
]]>The latest Reason-Rupe poll finds 70 percent of Americans favor legalizing over-the-counter birth control pills and patches without a doctor's prescription, 26 percent oppose such a proposal, and 4 percent don't know enough to say. There has been a slight uptick in support for OTC birth control, rising from 66 percent in May of 2013. Moreover, Reason-Rupe finds that women across income groups highly support legalizing OTC birth control at about the same rates.
The American College of Obstetricians and Gynecologists have announced their support for such a proposal arguing it could improve contraceptive access and use and decrease unintended pregnancy rates. Republicans too have been pushing for this reform, with Democrats surprisingly reluctant.
Republican Gov. Bobby Jindal raised the idea in 2012 in his widely read Wall Street Journal op-ed:
"As an unapologetic pro-life Republican, I also believe that every adult (18 years old and over) who wants contraception should be able to purchase it. But anyone who has a religious objection to contraception should not be forced by government health-care edicts to purchase it for others. And parents who believe, as I do, that their teenage children shouldn't be involved with sex at all do not deserve ridicule."
Planned Parenthood and some Democrats have pushed back, expressing concerns that legalizing OTC birth control would require women to pay for it, rather than have it paid for by their health insurance premiums. For instance, Rebecca Leber explained:
"For low-income women, cost can be what's most prohibitive. Under the Affordable Care Act, the pill and other forms of contraception count as preventative care, which means insurance covers them completely—without any out-of-pocket expenses."
Planned Parenthood recently released an ad in North Carolina warning: "Just when insurance is finally covering the cost of prescription birth control, Thom Tillis [the Republican] says no—women should pay the $600 dollars a year…he's turning the pill into yet another bill." To be clear, Democrats are not necessarily opposed to legalizing OTC birth control, but rather they want to ensure women don't have to pay for it.
Reason's own Elizabeth Brown has countered:
"Affordability isn't the only factor in making something accessible. Those championing the contraception mandate as a way to increase access assume everyone always has insurance coverage. What about undocumented women? Or those between jobs and temporarily uninsured? What about young women who can't let their parents know they're on the pill? Or domestic abuse victims who want to keep this information from their husbands? These are just a few of the situations in which a woman would find OTC pills much more accessible and affordable than the prescription-only kind, even if those prescription pills came with no co-pay."
Despite costs concerns, OTC birth control legalization receives strong support from women across income groups at roughly the same rates. Among women making less than $30,000 a year, 65 percent support legalization and 35 percent oppose. In the middle, women making between $30K-$60K a year support the proposal 70 to 29 percent. And again, among women making more than $60,000 a year, 67 percent support and 32 percent oppose legalizing OTC birth control.
Men too support legalization, 71 percent to 21 percent, similar to women, 68 to 30 percent.
In addition, support for legalization is high across race and ethnicity. Seventy-two percent of Caucasians, 73 percent of African-Americans, and 61 percent of Hispanics say OTC birth control should be legal.
Legalization has bi-partisan support as well. In fact, Republicans and Democrats support it at roughly the same level (65% and 69% respectively) with Independents even more in favor (74%).
Elite debate over the issue has trickled down to some degree, with libertarians (75%) and conservatives (71%) more in favor than liberals (64%) and communitarians (62%). (Political groups identified using the Reason-Rupe three-question screen).
Despite concerns over the cost of OTC birth control, strong majorities across income groups favor the proposal. For instance, 64 percent of Americans making less than $30,000 annually support legalization as do 69 percent of those making more than $100,000.
The Reason-Rupe national telephone poll, executed by Princeton Survey Research Associates International, conducted live interviews with 1004 adults on cell phones (503) and landlines (501) October 1-6, 2014. The poll's margin of error is +/-3.8%. Full poll results can be found here including poll toplines (pdf) and crosstabs (xls).
The post Poll: 70% Favor Legalizing Over-The-Counter Birth Control appeared first on Reason.com.
]]>The latest Reason-Rupe poll finds 70 percent of Americans favor legalizing over-the-counter birth control pills and patches without a doctor's prescription, 26 percent oppose such a proposal, and 4 percent don't know enough to say. There has been a slight uptick in support for OTC birth control, rising from 66 percent in May of 2013. Moreover, Reason-Rupe finds that women across income groups highly support legalizing OTC birth control at about the same rates.
The American College of Obstetricians and Gynecologists have announced their support for such a proposal arguing it could improve contraceptive access and use and decrease unintended pregnancy rates. Republicans too have been pushing for this reform, with Democrats surprisingly reluctant.
Republican Gov. Bobby Jindal raised the idea in 2012 in his widely read Wall Street Journal op-ed:
"As an unapologetic pro-life Republican, I also believe that every adult (18 years old and over) who wants contraception should be able to purchase it. But anyone who has a religious objection to contraception should not be forced by government health-care edicts to purchase it for others. And parents who believe, as I do, that their teenage children shouldn't be involved with sex at all do not deserve ridicule."
Planned Parenthood and some Democrats have pushed back, expressing concerns that legalizing OTC birth control would require women to pay for it, rather than have it paid for by their health insurance premiums. For instance, Rebecca Leber explained:
"For low-income women, cost can be what's most prohibitive. Under the Affordable Care Act, the pill and other forms of contraception count as preventative care, which means insurance covers them completely—without any out-of-pocket expenses."
Planned Parenthood recently released an ad in North Carolina warning: "Just when insurance is finally covering the cost of prescription birth control, Thom Tillis [the Republican] says no—women should pay the $600 dollars a year…he's turning the pill into yet another bill." To be clear, Democrats are not necessarily opposed to legalizing OTC birth control, but rather they want to ensure women don't have to pay for it.
Reason's own Elizabeth Brown has countered:
"Affordability isn't the only factor in making something accessible. Those championing the contraception mandate as a way to increase access assume everyone always has insurance coverage. What about undocumented women? Or those between jobs and temporarily uninsured? What about young women who can't let their parents know they're on the pill? Or domestic abuse victims who want to keep this information from their husbands? These are just a few of the situations in which a woman would find OTC pills much more accessible and affordable than the prescription-only kind, even if those prescription pills came with no co-pay."
Despite costs concerns, OTC birth control legalization receives strong support from women across income groups at roughly the same rates. Among women making less than $30,000 a year, 65 percent support legalization and 35 percent oppose. In the middle, women making between $30K-$60K a year support the proposal 70 to 29 percent. And again, among women making more than $60,000 a year, 67 percent support and 32 percent oppose legalizing OTC birth control.
Men too support legalization, 71 percent to 21 percent, similar to women, 68 to 30 percent.
In addition, support for legalization is high across race and ethnicity. Seventy-two percent of Caucasians, 73 percent of African-Americans, and 61 percent of Hispanics say OTC birth control should be legal
Legalization has bi-partisan support as well. In fact, Republicans and Democrats support it at roughly the same level (65% and 69% respectively) with Independents even more in favor (74%).
Elite debate over the issue has trickled down to some degree, with libertarians (75%) and conservatives (71%) more in favor than liberals (64%) and communitarians (62%). (Political groups identified using the Reason-Rupe three-question screen).
Despite concerns over the cost of OTC birth control, strong majorities across income groups favor the proposal. For instance, 64 percent of Americans making less than $30,000 annually support legalization as do 69 percent of those making more than $100,000.
The Reason-Rupe national telephone poll, executed by Princeton Survey Research Associates International, conducted live interviews with 1004 adults on cell phones (503) and landlines (501) October 1-6, 2014. The poll's margin of error is +/-3.8%. Full poll results can be found here including poll toplines (pdf) and crosstabs (xls)
The post Poll: 70% Favor Legalizing Over-The-Counter Birth Control appeared first on Reason.com.
]]>Original post from October 16, 2014. Text is below:
"There seems to be a sort of collective amnesia problem regarding the Iraq War," says Reason Foundation polling director Emily Ekins.
Ekins is referring to a question contained in the October 2014 Reason-Rupe poll, which found that 51 percent of Americans recall opposing the Iraq invasion in 2003. In reality, Pew found that most Americans—72 percent—supported the war at the time of the invasion. Ekins says its fairly common to find such discrepancies in public opinion polling. People tend to want to say they supported the winner and opposed the loser.
"And this tells us something about how Americans view the Iraq War," says Ekins.
Reason TV questioned a handful of passersby in Venice, California, to illustrate some Americans' attitudes toward the current military intervention against ISIS in Iraq and Syria. Here are some key findings from the October poll:
Air strikes are popular.
Some 66 percent of Americans favor airstrikes to combat ISIS in Iraq and Syria. This was a fairly consistent finding across age groups and partisans, with one glaring exception: Young people. Fifty-one percent of respondents younger than 30 oppose airstrikes.
Ground troops are unpopular.
Most Americans oppose sending ground troops to combat ISIS. Only 43 percent favor John McCain and Lindsey Graham's preferred solution.
Congress is shirking its duty when it comes to foreign policy in the minds of most Americans.
A whopping 78 percent of Americans believe Congress should return from recess to vote one way or another on an authorization for the use of military force against ISIS. Most people think Congress hasn't done so because its members don't want to put a vote on the official record.
Americans are increasingly concerned about the potential unintended consequences of intervention.
Fifty-five percent of Americans oppose the United States arming Syrian rebels, and 78 percent believe there is a chance such weapons would eventually be used against the U.S.
"Americans are going to appreciate politicians who can demonstrate an ability to be deliberative, but also strong, in how they make foreign policy decisions," says Ekins.
Watch the full video above, or click below for downloadable versions. And subscribe to Reason TV's YouTube channel for daily content like this.
The post VID: What Americans Really Think About ISIS (Reason-Rupe Poll, October 2014) appeared first on Reason.com.
]]>The latest Reason-Rupe poll finds that a solid majority—66 percent—of Americans favors conducting air strikes against ISIS in Iraq and Syria. While 52 percent oppose sending ground troops to Iraq, 58 percent believe sending at least a small number of troops (24%) or even a large number (34%) will be necessary to successfully combat ISIS.
While Politicians often wish to avoid discussing trade-offs, the Reason-Rupe poll asked Americans how they would like to pay for military against ISIS in Iraq and Syria. Somewhat predictably, two groups emerge: 35 percent say cut non-entitlement federal spending, another 34 percent say raise taxes on wealthy people. Another 8 percent say we should raise taxes on all income groups, 6 percent want to borrow the money, and 4 percent want to cut entitlement programs to pay for military action.
If federal spending had to be cut to pay for military action, Americans say they would first cut social safety net programs (19%) like food stamps, unemployment benefits, and Medicaid, another 17 percent say they would cut infrastructure and transportation spending. Nine percent would cut government-funded science and medical research, 7 percent would cut entitlement programs, 3 percent would cut education, 2 percent would cut veterans programs. In fact, a total of 8 percent actually volunteered another answer that was not offered on the survey: cutting Congressional salaries. Another three percent said there were literally no programs that could be cut. One middle-aged man from Philadelphia said "none of the programs" could be cut because "they are all vital to our survival." Twelve percent offered a variety of other smaller programs to cut, and another 19 percent didn't know what to cut.
Overall, these data reflect a predictable pattern—Americans want other people to bear the costs of various government activity, either in form of taxing rich people or cutting social services for low-income individuals.
The Reason-Rupe national telephone poll, executed by Princeton Survey Research Associates International, conducted live interviews with 1004 adults on cell phones (503) and landlines (501) October 1-6, 2014. The poll's margin of error is +/-3.8%. Full poll results can be found here including poll toplines (pdf) and crosstabs (xls).
The post Americans Favor Airstrikes to Combat ISIS But Are Unsure How to Pay for It, As Usual appeared first on Reason.com.
]]>The latest Reason-Rupe poll finds that a solid majority—66 percent—of Americans favors conducting air strikes against ISIS in Iraq and Syria. While 52 percent oppose sending ground troops to Iraq, 58 percent believe sending at least a small number of troops (24%) or even a large number (34%) will be necessary to successfully combat ISIS.
While Politicians often wish to avoid discussing trade-offs, the Reason-Rupe poll asked Americans how they would like to pay for military against ISIS in Iraq and Syria. Somewhat predictably, two groups emerge: 35 percent say cut non-entitlement federal spending, another 34 percent say raise taxes on wealthy people. Another 8 percent say we should raise taxes on all income groups, 6 percent want to borrow the money, and 4 percent want to cut entitlement programs to pay for military action.
If federal spending had to be cut to pay for military action, Americans say they would first cut social safety net programs (19%) like food stamps, unemployment benefits, and Medicaid, another 17 percent say they would cut infrastructure and transportation spending. Nine percent would cut government-funded science and medical research, 7 percent would cut entitlement programs, 3 percent would cut education, 2 percent would cut veterans programs. In fact, a total of 8 percent actually volunteered another answer that was not offered on the survey: cutting Congressional salaries. Another three percent said there were literally no programs that could be cut. One middle-aged man from Philadelphia said "none of the programs" could be cut because "they are all vital to our survival." Twelve percent offered a variety of other smaller programs to cut, and another 19 percent didn't know what to cut.
Overall, these data reflect a predictable pattern—Americans want other people to bear the costs of various government activity, either in form of taxing rich people or cutting social services for low-income individuals.
The Reason-Rupe national telephone poll, executed by Princeton Survey Research Associates International, conducted live interviews with 1004 adults on cell phones (503) and landlines (501) October 1-6, 2014. The poll's margin of error is +/-3.8%. Full poll results can be found here including poll toplines (pdf) and crosstabs (xls).
The post Americans Favor Airstrikes to Combat ISIS But Are Unsure How to Pay for It appeared first on Reason.com.
]]>The latest Reason-Rupe survey used a three-question screen to glean Americans' predispositions toward government. Many Americans are unclear which ideological label best describes their views about government, and many feel the traditional labels don't fit them. For instance, some may feel they agree with Republicans on economics but with Democrats on social issues. Or others may agree with Democrats on the role for government, but side with Republicans on social issues.
Consequently, Reason-Rupe asked three questions to measure Americans' preferred level of government involvement in economic and personal affairs respectively:
Reason-Rupe identified five political groupings according to the following rubric:
To be sure, these typologies are different than respondents' self-described views. Reason-Rupe found that 28 percent of Americans self-identify as conservative, 24 percent as moderate, 15 percent as liberal, 5 percent as libertarian, 10 percent as progressive, 12 percent as something else, and 6 percent did not know.
Certainly, using only three questions to categorize people's political views has its limitations. However, the benefit of using this particular three-question screen is that these are commonly asked questions and can be more easily included on surveys on a consistent basis.
The post Reason-Rupe Ideological Typology: Where Do You Fit? appeared first on Reason.com.
]]>Americans are becoming increasingly skeptical that strategic US military interventions abroad won't eventually backfire. The latest Reason-Rupe poll finds that 55 percent of Americans oppose arming Syrian rebels in efforts to fight against ISIS, while 35 percent support such action.
One reason Americans oppose sending weapons to the rebels may be that they believe there's a 78 percent chance those weapons will eventually be turned around and used against American soldiers or US allies.
Public reluctance to arm Syrian rebels to fight ISIS may be indicative of a broader hesitancy to be as involved in the Middle Eastern region. Reason-Rupe finds only 28 percent of Americans want to increase US military presence around the world. Another 36 percent want to decrease American global military presence, and another third are content with the status quo.
Perhaps one reason Americans aren't more supportive of expanding US involvement is disillusionment with US handling of the 2003 Iraq War. Only 14 percent believe the war actually reduced the threat of terrorism; another 38 percent think it instigated even more terrorism. Forty-five percent think the Iraq war had little effect protecting US citizens from terrorist threats.
Foreign policy hawkishness cuts across demographic groups and party lines but is certainly more pronounced among Republicans. In fact, Republicans are nearly twice as likely as both Democrats and independents to favor increasing US military presence abroad (41% versus 20% and 26% respectively). In reverse, Democrats and independents are almost twice as likely as Republicans to want to decrease military presence (42% and 39% versus 25% respectively.)
Consistent with findings that young people are the only group to oppose air strikes against ISIS, Americans under 34 are about half as likely (21%) as Americans over 55 (37%) to desire an expanded global military presence. Instead, 41 percent of younger Americans want to reduce US military presence abroad compared to 27 percent of those over 55. A third of both groups support the status quo.
Opposition to arming Syrian rebels, however, is generally non-partisan. Sixty-one percent of Republicans, 58 percent of independents, and 51 percent of Democrats oppose the US providing weapons to rebel groups to fight ISIS.
Again, younger people are more skeptical of intervention. Only 28 percent of 18-29 year olds support arming Syrian rebels, and 62 percent oppose doing so. In contrast, 45 percent of seniors favor providing weapons and 47 percent oppose.
Americans are beginning to believe there are limits to the US's ability to engineer favorable outcomes through military interventions abroad. There are fears that weapons we provide to assumed allies will be the very weapons we are fighting against in the future. There are also serious concerns that our past military strategies have not achieved their desired outcomes, and have not reduced the threat of terrorism.
The Reason-Rupe national telephone poll, executed by Princeton Survey Research Associates International, conducted live interviews with 1004 adults on cell phones (503) and landlines (501) October 1-6, 2014. The poll's margin of error is +/-3.8%. Full poll results can be found here including poll toplines (pdf) and crosstabs (xls).
The post Poll: If We Arm Syrian Rebels Americans Say 78% Chance Weapons Will Be Used Against US Eventually appeared first on Reason.com.
]]>Americans are becoming increasingly skeptical that strategic US military interventions abroad won't eventually backfire. The latest Reason-Rupe poll finds that 55 percent of Americans oppose arming Syrian rebels in efforts to fight against ISIS, while 35 percent support such action.
One reason Americans oppose sending weapons to the rebels may be that they believe there's a 78 percent chance those weapons will eventually be turned around and used against American soldiers or US allies.
Public reluctance to arm Syrian rebels to fight ISIS may be indicative of a broader hesitancy to be as involved in the Middle Eastern region. Reason-Rupe finds only 28 percent of Americans want to increase US military presence around the world. Another 36 percent want to decrease American global military presence, and another third are content with the status quo.
Perhaps one reason Americans aren't more supportive of expanding US involvement is disillusionment with US handling of the 2003 Iraq War. Only 14 percent believe the war actually reduced the threat of terrorism; another 38 percent think it instigated even more terrorism. Forty-five percent think the Iraq war had little effect protecting US citizens from terrorist threats.
Foreign policy hawkishness cuts across demographic groups and party lines but is certainly more pronounced among Republicans. In fact, Republicans are nearly twice as likely as both Democrats and independents to favor increasing US military presence abroad (41% versus 20% and 26% respectively). In reverse, Democrats and independents are almost twice as likely as Republicans to want to decreasemilitary presence (42% and 39% versus 25% respectively.)
Consistent with findings that young people are the only group to oppose air strikes against ISIS, Americans under 34 are about half as likely (21%) as Americans over 55 (37%) to desire an expanded global military presence. Instead, 41 percent of younger Americans want to reduce US military presence abroad compared to 27 percent of those over 55. A third of both groups support the status quo.
Opposition to arming Syrian rebels, however, is generally non-partisan. Sixty-one percent of Republicans, 58 percent of independents, and 51 percent of Democrats oppose the US providing weapons to rebel groups to fight ISIS.
Again, younger people are more skeptical of intervention. Only 28 percent of 18-29 year olds support arming Syrian rebels, and 62 percent oppose doing so. In contrast, 45 percent of seniors favor providing weapons and 47 percent oppose.
Americans are beginning to believe there are limits to the US's ability to engineer favorable outcomes through military interventions abroad. There are fears that weapons we provide to assumed allies will be the very weapons we are fighting against in the future. There are also serious concerns that our past military strategies have not achieved their desired outcomes, and have not reduced the threat of terrorism.
The Reason-Rupe national telephone poll, executed by Princeton Survey Research Associates International, conducted live interviews with 1004 adults on cell phones (503) and landlines (501) October 1-6, 2014. The poll's margin of error is +/-3.8%. Full poll results can be found here including poll toplines (pdf) and crosstabs (xls).
The post Poll: If We Arm Syrian Rebels Americans Say 78% Chance Weapons Will Be Used Against US Eventually appeared first on Reason.com.
]]>According to the latest Reason-Rupe poll, 43 percent of Americans approve of the way Barack Obama is handling his job as President, while 50 percent of Americans disapprove. When asked specifically about President Obama's handling of foreign policy, the percentage of those who approve drops to 38 percent, while a majority of Americans—51 percent—disapprove of his handling of foreign policy. These results remain largely unchanged since August.
A third of political independents (includes partisan leaners) say they approve of both President Obama's job performance and his handling of foreign policy. Roughly 54 percent disapprove of his handling of both.
Democrats are more likely to favor Obama's overall job performance (76%) than foreign policy handling (65%). About a quarter of Democrats disapprove of President Obama. Only about 12 percent of Republicans approve of either the president's overall job performance or foreign policy.
Young people still like the President: 49 percent of Americans between the ages of 18-34 approve of the way Barack Obama is handling his job as President. This number slightly declines to 40 percent who approve of his foreign policy. Americans over 55 are nearly equally likely to both disapprove of the president's foreign policy and overall job performance (56% disapprove, 36% approve).
Significant perception differences remain across race and ethnicity. About 3 in 10 white Americans oppose Obama's general job and foreign policy handling, while 6 in 10 disapprove. Among African-Americans, 84 percent approve of general job performance and 73 percent of his foreign policy. Among Hispanics, 57 percent approve of Obama overall and 49 percent of his foreign policy.
When asked to compare President Obama to his predecessor George W. Bush, only 35 percent prefer Obama's foreign policy. Twenty-eight percent think the two have handled foreign policy about the same, and 33 percent think Obama has done a worse job than Bush.
The Reason-Rupe national telephone poll, executed by Princeton Survey Research Associates International, conducted live interviews with 1004 adults on cell phones (503) and landlines (501) October 1-6, 2014. The poll's margin of error is +/-3.8%. Full poll results can be found here including poll toplines (pdf) and crosstabs (xls).
The post Poll: 51% Disapprove of Obama's Handling of Foreign Policy, 35% Say Obama Has Handled Foreign Policy Better than Bush appeared first on Reason.com.
]]>Ekins is referring to a question contained in the October 2014 Reason-Rupe poll, which found that 51 percent of Americans recall opposing the Iraq invasion in 2003. In reality, Pew found that most Americans—72 percent—supported the war at the time of the invasion. Ekins says its fairly common to find such discrepancies in public opinion polling. People tend to want to say they supported the winner and opposed the loser.
"And this tells us something about how Americans view the Iraq War," says Ekins.
Reason TV questioned a handful of passersby in Venice, California, to illustrate some Americans' attitudes toward the current military intervention against ISIS in Iraq and Syria. Here are some key findings from the October poll:
Air strikes are popular.
Some 66 percent of Americans favor airstrikes to combat ISIS in Iraq and Syria. This was a fairly consistent finding across age groups and partisans, with one glaring exception: Young people. Fifty-one percent of respondents younger than 30 oppose airstrikes.
Ground troops are unpopular.
Most Americans oppose sending ground troops to combat ISIS. Only 43 percent favor John McCain and Lindsey Graham's preferred solution.
Congress is shirking its duty when it comes to foreign policy in the minds of most Americans.
A whopping 78 percent of Americans believe Congress should return from recess to vote one way or another on an authorization for the use of military force against ISIS. Most people think Congress hasn't done so because its members don't want to put a vote on the official record.
Americans are increasingly concerned about the potential unintended consequences of intervention.
Fifty-five percent of Americans oppose the United States arming Syrian rebels, and 78 percent believe there is a chance such weapons would eventually be used against the U.S.
"Americans are going to appreciate politicians who can demonstrate an ability to be deliberative, but also strong, in how they make foreign policy decisions," says Ekins.
Watch the full video above, or click below for downloadable versions. And subscribe to Reason TV's YouTube channel for daily content like this.
Produced by Zach Weissmueller. Camera by Paul Detrick. Music by Chris Zabriskie.
The post What Americans Really Think About ISIS (Reason-Rupe Poll, October 2014) appeared first on Reason.com.
]]>Americans have a bit of collective amnesia when it comes to remembering their stance on the Iraq War when it first began in 2003. The latest Reason-Rupe poll finds that 51 percent of Americans report they were opposed to the Iraq War back when it started in 2003; 39 percent say they supported the war, 6 percent report not having had an opinion, and 5 percent can't remember.
However, a Pew Research Center poll conducted in March 2003, as the Iraq War began, found fully 72 percent of Americans supported the war, 23 percent were opposed, and 5 percent didn't have an opinion.
Among the 39 percent of Americans who remember supporting the Iraq War in 2003, 61 percent are in favor of returning ground troops to Iraq to combat ISIS. Among those who say they opposed the 2003 Iraq war, 66 percent oppose sending ground troops to Iraq.
Only 26 percent of Democrats say they recall supporting the 2003 Iraq War when it began and 65 percent say they had been opposed. However, 59 percent of Republicans report having supported the war while 33 percent say they had been opposed to it. A plurality (41%) of independents say they had opposed the war, 36 percent say they had supported it, and 23 percent either couldn't remember or didn't have an opinion.
The Reason-Rupe national telephone poll, executed by Princeton Survey Research Associates International, conducted live interviews with 1004 adults on cell phones (503) and landlines (501) October 1-6, 2014. The poll's margin of error is +/-3.8%. Full poll results can be found here including poll toplines (pdf) and crosstabs (xls).
The post Poll Reveals Americans Supported Iraq War in 2003 Far More Than They Admit Today appeared first on Reason.com.
]]>Despite promises to improve America's foreign policy handling, only 35 percent of Americans think President Obama has done a better job than his predecessor George W. Bush, according to the latest Reason-Rupe poll. Another 28 percent say Obama has done no better nor worse than President Bush, and 33 percent say he's done an even worse job.
One age group stands out in their evaluation comparing Obama to Bush—and it's not today's college-age kids. Americans who were between the ages of 18-29 in 2003 when President Bush led the country into war in Iraq are the most likely group (48%) to say President Obama has done a better job handling foreign policy than Bush. In contrast, only a third or less of virtually every other age group agree—even today's youngest cohort who hadn't yet turned 18 in 2003.
Research shows that young adults are most politically impressionable in early adulthood, particularly the ages of 18-29. Americans who were in this age group in 2003 and witnessed the national debate and invasion of Iraq in their formative years continue to be much more likely to favor President Obama's approach to foreign affairs compared to his predecessor.
Increased support for Obama's foreign policy is not simply a product of youth. Today's very youngest adult cohort, those who were under 18 in 2003, are no more likely than older age groups to view Obama's foreign policy as an improvement. Instead, those who were 18-29 in 2003 (and now between the ages of 30 and 40) remain an outlier in their preference for Obama over Bush.
These data suggest Americans born between the mid 70s and 80s may carry with them into the future distinctive foreign policy views, uniquely shaped by the rhetoric and actions of President George W. Bush.
The Reason-Rupe national telephone poll, executed by Princeton Survey Research Associates International, conducted live interviews with 1004 adults on cell phones (503) and landlines (501) October 1-6, 2014. The poll's margin of error is +/-3.8%. Full poll results can be found here including poll toplines (pdf) and crosstabs (xls).
The post Poll: 35% Say Obama Has Handled Foreign Policy Better Than George W. Bush; Americans Who Were 20-Somethings in 2003 More Critical of Bush appeared first on Reason.com.
]]>If November's election for Congress were held today, 42 percent of registered voters say they would vote for the Democratic candidate in their district, 33 percent would vote for the Republican in their district, 13 percent would vote third party, and 11 percent don't know whom they'd vote for yet, according to the latest Reason-Rupe poll.
One may notice these results diverge from Real Clear Politics' 2014 Generic Congressional Vote aggregator which finds among likely voters, 45.3 say they plan to vote Republican and 43.5 percent Democratic.
What explains the difference?
Reason-Rupe offers respondents the option to select a third-party candidate while other polls offer the two-party choices and then ask undecided voters which way they lean. (For instance, see these Fox News, and Gallup polls). There's nothing wrong with asking about only two parties, and will likely yield a more predictive result. However, offering a third-party option reveals which voters are most dissatisfied with the two-party candidate choices, and thus who is at high risk of defection come Election Day.
The fact that a third-party candidate could win or influence the election in several races (e.g. Kansas or North Carolina) demonstrates the importance of identifying the likely "defectors."
Who wants to vote third party?
Our data suggests likely third-party "defectors" might otherwise be potential Republican voters, given that other polls find the parties tied except when a third-party option is made available. But that doesn't mean these voters are Republicans either.
Third party voters tend to be disproportionately younger, male, independent, leaning left, but also lean libertarian on the size of government.
Third-party voters come from both the partisan left and right, and are slightly more representative of Independent-leaning Democrats (34% v 17% national) than Independent-leaning Republicans (18% v 10% national). Nevertheless, they tend to agree with Republicans on the size of government and are as likely as the national sample to be tea party supporters.
When it comes to attitudes toward the police, criminal justice reform, and foreign policy, third-party voters tend to side with Democrats. (See Table) These voters are less favorable of the police (61%), believe the police are not held accountable for misconduct (54%), favor restoring voting rights to non-violent drug offenders (82%), and allowing such offenders to petition a court to have their records sealed (50%).
When it comes to the US combatting ISIS, third-party voters are about as skeptical of air strikes as Democrats (28%), although a majority still favor (64%) their use. Also like Democrats, these voters (52%) oppose sending ground troops to combat ISIS.
However, on economic issues, third-party voters act more like Republicans. These voters tend to say we should pay for military action against ISIS primarily by cutting spending (41%) rather than raising taxes on the wealthy (33%), and that we should lower corporate taxes (54%). Also similar to Republicans, third-party voters say its is acceptable for a business to move states to lower its tax load (73%).
Third-party voters also align with Republicans on the size of government. In a complete reverse from Democrats, 64 percent of third-party voters prefer a smaller government offering fewer services, while 29 percent prefer larger government providing more services (29%). Similarly, 63 percent say free markets solve problems better than a strong government (33%).
Third-party voters are also the only political group in which a majority support allowing unvaccinated children to attend public schools (54%).
What does this mean?
These third-party voters, who likely pose the greatest electoral risk to Republicans, have a marked libertarian streak. They favor constraining government's economic and policing powers and are relatively less interventionist militarily. These data provide a strong indication that Republicans looking to win back votes from likely defectors may need to expand their issue priorities to include criminal justice reform, but also to moderate their positions on foreign policy.
The Reason-Rupe national telephone poll, executed by Princeton Survey Research Associates International, conducted live interviews with 1004 adults on cell phones (503) and landlines (501) October 1-6, 2014. The poll's margin of error is +/-3.8%. Full poll results can be found here. including poll toplines (pdf) and crosstabs (xls).
The post Poll: Third-Party Voters Side With Democrats on Police and Foreign Policy and with Republicans on Economics appeared first on Reason.com.
]]>On Monday, protesters in Ferguson, MO continued their fourth day of renewed protests over the police shooting of an unarmed black teenager, Michael Brown. Protestors brought signs and t-shirts with slogans including "Black Lives Matter" and "My Blackness is Not a Weapon." The incident has reignited public debate over accountability and racial bias in the nation's police departments and the criminal justice system more generally.
The latest Reason-Rupe poll finds 44 percent of Americans believe the criminal justice system in the United States treats white Americans more fairly than black and Hispanic Americans. Another 45 percent believe the system treats all racial groups the same, 6 percent think the system favors black and Hispanic Americans, and 5 percent aren't sure.
When it comes to perceptions of systemic bias in the criminal justice system, Democrats are significantly more likely to perceive bias than Republicans and independents. Fifty-nine percent of Democrats believe America's criminal justice system treats white Americans more fairly than minorities; only 35 percent think the system treats all fairly. In stark contrast, 62 percent of Republicans believe the system treats everyone equally under the law, while 26 percent say white Americans are treated better. Independents are divided with 40 percent who say the justice system is fair, and 37 percent who believes it's biased against minorities.
African-Americans and Hispanics are also significantly more likely than white Americans to perceive systemic bias. Fully 83 percent of African-Americans and 62 percent of Hispanics say whites are treated more fairly than minorities. Only 34 percent of white Americans agree that the system gives them preferential treatment; instead, 53 percent believe the system treats all Americans equally.
Younger Americans are much more likely to perceive bias in the system than older Americans, and this cannot be fully explained by greater diversity among younger cohorts. Among 18-34 year olds, 54 percent say the justice system is biased in favor of white Americans, while 40 percent think it treats everyone the same. Americans 35-54 are evenly divided with slightly more (47%) perceiving bias than equal treatment (42%). However, among Americans over 55, a majority—52 percent—says the justice system is fair to everyone, 34 percent perceive a bias in favor of Caucasians.
There is even a slight difference between men and women on perception of bias. A plurality (49%) of women believes white Americans are treated more fairly and 40 percent think the justice system treats all equally. Conversely, 50 percent of men believe the system is fair, and 39 percent believe white Americans are treated more fairly.
Reason-Rupe also finds that Americans living in urban areas are more likely to perceive unequal treatment in favor of Caucasians in the criminal justice system: 55 to 37 percent. In suburban areas, a plurality (47%) believes the system is fair to everyone while 41 percent perceive a bias against minorities. Conversely, a majority (54 percent) of Americans in rural areas say the criminal justice system treats everyone the same, while 34 percent perceive a bias in favor of white Americans.
When we compare these results to the average elected official, such as those in Congress, we find that politicians come from the very demographic groups least likely to believe there is bias in the criminal justice system:
The average member of Congress in 2014 is 57 years old, college-educated, male, and Caucasian. Using a statistical technique, we find a person with the same demographics as the average member of Congress has a 65% chance of believing the criminal justice system in America is fair to all racial groups. In contrast, a similar nonwhite female who is 40-years-old is 26 percent likely to agree.
Basically, those in elected office are most likely to come from demographic groups least likely to detect bias in the criminal justice system. This may help explain why Ferguson residents are so upset—they feel those in power do not believe them nor care about them.
This does not mean that one group is necessarily completely right while the other is completely wrong. This also does not suggest that racial animus implicitly drives those who don't perceive bias in the system. However, the very presence of these stark demographic and partisan differences incontrovertibly merits our close attention. Yet, these very differences are what make constructive debate over criminal justice reform so challenging.
America stands for equal treatment under the law predicated on the belief that all individuals' share inherent equal dignity. However, these tenants are nothing more than empty promises if the state's most powerful tool—its police power—is misused or applied inconsistently. If police power is misapplied, partisan and racial perception differences make it even more difficult to have a constructive debate about it. Until there is greater mutual willingness to listen to the experiences of others, reform and renewal may remain elusive.
The Reason-Rupe national telephone poll, executed by Princeton Survey Research Associates International, conducted live interviews with 1004 adults on cell phones (503) and landlines (501) October 1-6, 2014. The poll's margin of error is +/-3.8%. Full poll results can be found here. including poll toplines (pdf) and crosstabs (xls).
The post Poll: 59% of Democrats Say Criminal Justice System Treats White Americans More Fairly Than Minorities, 62% of Republicans Say System Treats All Equally appeared first on Reason.com.
]]>Protests in Ferguson continue today over the police shooting of an unarmed black teenager, Michael Brown.
The latest Reason-Rupe poll asked Americans what they thought about a number of issues in the criminal justice system including their perceptions of police abuse, accountability in police departments, and racial bias and injustice.
POLICE POLL RESULTS FOUND HERE
The latest poll finds fully 70 percent of Americans oppose the use of racial profiling in police departments, while 25 percent support this practice. Breaking these numbers down further, 48 percent strongly disapprove, 22 percent somewhat disapprove, while 12 percent somewhat approve and 13 percent strongly approve.
The question was careful to avoid using the actual words racial profiling, but described it as follows: "It has been reported that some police officers stop motorists or pedestrians of certain racial or ethnic groups because the officers believe that these groups are more likely than others to commit certain types of crimes. Do you approve or disapprove of this practice by the police?"
Considerable demographic and even partisan differences emerge on the practice of racial profiling.
While majorities of Democrats, Republicans, and Independents oppose the practice, Democrats are far more likely to oppose with much stronger intensity. Fully 81 percent of Democrats oppose, including 62 percent who strongly oppose; 17 percent support the practice. Seventy-one percent of independents oppose, including 48 percent who strongly oppose; 20 percent approve.
A majority of Republicans are also opposed, but less so than Democrats and Independents, with 55 percent opposed and only 28 percent strongly opposed. Thirty-seven percent of Republicans favor the use of racial profiling including 22 who stronglyapprove. It should be noted that tea party supporters are not significantly different from regular Republicans who do not support the movement (55 and 59 percent respectively oppose racial profiling, respectively).
Using Reason-Rupe's three-question screen1 to identify political groups, conservatives are the least likely to oppose the use of racial profiling, although a majority still oppose (53%). Libertarians are nearly twenty points more likely than conservatives to oppose police use of racial profiling (69%), and liberals and communitarians are the most likely to oppose the practice, 83 and 79 percent respectively.
White Americans (28%) are nearly twice as likely as African-Americans and Hispanics (14%) to approve of racial profiling by the police. Nevertheless, strong majorities of all racial groups oppose of the practice, 65 percent and 86 percent respectively. In fact, fully 81 percent of African-Americans strongly disapprove of this practice, compared to 62 percent of Hispanics and 40 percent of white Americans.
While all age groups disapprove of racial profiling, older people do so with less intensity. Fifty-three percent of Americans under age 55 stronglydisapprove of racial profiling, and 20 percent somewhat disapprove. However, among Americans over 55, only 40 percent strongly disapprove and 26 percent somewhat disapprove.
Many may find it troubling that those who support racial profiling are also the most likely (64%) to believe the criminal justice system in American treats all racial groups equally while 25 percent believe the system gives preferential treatment to white Americans. In contrast, among those who oppose racial profiling, 53 percent believe the system is biased against minorities, and 37 percent believe all are treated equally. Overall, Americans are divided in their perception of actual systematic bias: 44 percent say the criminal justice system treats black and Hispanic Americans less fairly than white Americans. Another 45 percent say the system treats everyone equally under the law. Similar partisan and demographic patterns emerge, but considerably more dramatic.
The Reason-Rupe national telephone poll, executed by Princeton Survey Research Associates International, conducted live interviews with 1004 adults on cell phones (503) and landlines (501) October 1-6, 2014. The poll's margin of error is +/-3.8%. Full poll results can be found here. including poll toplines (pdf) and crosstabs (xls).
Three Question Screen Includes1:
1) Next…as I read the following pairs of statements, please tell me which comes closer to your own opinion. First, we need a strong government to handle today's complex economic problems; OR, people would be better able to handle today's problems within a free market with less government involvement.
2) Some people think the government should promote traditional values in our society. Others think the government should not favor any particular set of values. Which comes closer to your own view?
3) If you had to choose, would you rather have a smaller government providing fewer services, or a larger government providing more services?
The post Poll: 70% of Americans Oppose Racial Profiling by the Police appeared first on Reason.com.
]]>Protests in Ferguson continue today over the police shooting of an unarmed black teenager, Michael Brown.
The latest Reason-Rupe poll asked Americans what they thought about a number of issues in the criminal justice system including their perceptions of police abuse, accountability in police departments, and racial bias and injustice.
POLICE POLL RESULTS FOUND HERE
The latest poll finds fully 70 percent of Americans oppose the use of racial profiling in police departments, while 25 percent support this practice. Breaking these numbers down further, 48 percent strongly disapprove, 22 percent somewhat disapprove, while 12 percent somewhat approve and 13 percent strongly approve.
The question was careful to avoid using the actual words racial profiling, but described it as follows: "It has been reported that some police officers stop motorists or pedestrians of certain racial or ethnic groups because the officers believe that these groups are more likely than others to commit certain types of crimes. Do you approve or disapprove of this practice by the police?"
Considerable demographic and even partisan differences emerge on the practice of racial profiling.
While majorities of Democrats, Republicans, and Independents oppose the practice, Democrats are far more likely to oppose with much stronger intensity. Fully 81 percent of Democrats oppose, including 62 percent who strongly oppose; 17 percent support the practice. Seventy-one percent of independents oppose, including 48 percent who strongly oppose; 20 percent approve.
A majority of Republicans are also opposed, but less so than Democrats and Independents, with 55 percent opposed and only 28 percent strongly opposed. Thirty-seven percent of Republicans favor the use of racial profiling including 22 who strongly approve. It should be noted that tea party supporters are not significantly different from regular Republicans who do not support the movement (55 and 59 percent respectively oppose racial profiling, respectively).
Using Reason-Rupe's three-question screen1 to identify political groups, conservatives are the least likely to oppose the use of racial profiling, although a majority still oppose (53%). Libertarians are nearly twenty points more likely than conservatives to oppose police use of racial profiling (69%), and liberals and communitarians are the most likely to oppose the practice, 83 and 79 percent respectively.
White Americans (28%) are nearly twice as likely as African-Americans and Hispanics (14%) to approve of racial profiling by the police. Nevertheless, strong majorities of all racial groups oppose of the practice, 65 percent and 86 percent respectively. In fact, fully 81 percent of African-Americans strongly disapprove of this practice, compared to 62 percent of Hispanics and 40 percent of white Americans.
While all age groups disapprove of racial profiling, older people do so with less intensity. Fifty-three percent of Americans under age 55 strongly disapprove of racial profiling, and 20 percent somewhat disapprove. However, among Americans over 55, only 40 percent strongly disapprove and 26 percent somewhat disapprove.
Many may find it troubling that those who support racial profiling are also the most likely (64%) to believe the criminal justice system in American treats all racial groups equally while 25 percent believe the system gives preferential treatment to white Americans. In contrast, among those who oppose racial profiling, 53 percent believe the system is biased against minorities, and 37 percent believe all are treated equally. Overall, Americans are divided in their perception of actual systematic bias: 44 percent say the criminal justice system treats black and Hispanic Americans less fairly than white Americans. Another 45 percent say the system treats everyone equally under the law. Similar partisan and demographic patterns emerge, but considerably more dramatic.
The Reason-Rupe national telephone poll, executed by Princeton Survey Research Associates International, conducted live interviews with 1004 adults on cell phones (503) and landlines (501) October 1-6, 2014. The poll's margin of error is +/-3.8%. Full poll results can be found here. including poll toplines (pdf) and crosstabs (xls).
Three Question Screen Includes1:
1) Next…as I read the following pairs of statements, please tell me which comes closer to your own opinion. First, we need a strong government to handle today's complex economic problems; OR, people would be better able to handle today's problems within a free market with less government involvement.
2) Some people think the government should promote traditional values in our society. Others think the government should not favor any particular set of values. Which comes closer to your own view?
3) If you had to choose, would you rather have a smaller government providing fewer services, or a larger government providing more services?
The post Poll: 70% of Americans Oppose Racial Profiling by the Police appeared first on Reason.com.
]]>When it comes to the use of lethal force, only 49 percent of Americans are confident the police only use it when necessary. Another 45 percent believe the police are too quick to pull the trigger. Some may find it quite troubling that on such an important issue, only half are confident in police officers' decisions.
There are significant differences in perception across race and ethnicity, as well as income and age. Younger, lower-income, and nonwhite Americans are considerably more likely than older, high-income, and white Americans to perceive injustice in the police force.
Nevertheless, majorities across all remain favorable toward their local law enforcement. However, African-American and Hispanic Americans are more likely than Caucasians to believe police abuse their authority and use force excessively. For instance, only 38 percent of white Americans believe excessive force in police departments is increasing, compared to 73 percent of African-Americans and 67 percent among Hispanics. Only 34 percent of Caucasians believe the police use lethal force unnecessarily, compared to 82 percent of African-Americans and 72 percent of Hispanics.
Differences in income cannot explain these race/ethnic disparities. Majorities of both lower and higher income nonwhite Americans say police abuse is on the rise and are just as likely to believe the police often use lethal force unnecessarily. However, lower income white Americans are more likely than middle class and higher income white Americans to perceive abuse of authority.
There are also regional differences in perception of police abuse. Fifty-four percent of those in urban areas say the police are too quick to use lethal force, compared to 35 percent of those in rural areas. Southerners are also more likely to say abuse is on the rise—52%—compared to only 38 percent of those in the Midwest.
Republicans don't think excessive force is increasing: 54 percent say it hasn't changed much, and fully 70 percent say the police only use lethal force when necessary. Democrats see things differently; 57 percent say cases of excessive force is on the rise and 61 percent say the police are too quick to use lethal force. Independents agree with Democrats' perception that cases of excessive force are on the rise—52 percent. However, 50 percent believe the police only use lethal force when necessary while 40 percent think the police are too quick to use it.
Perhaps ironically, Americans who prefer larger government are the most likely—58 percent—to believe excessive force by the police is on the rise and they are too quick to use lethal force. In contrast, 52 percent of Americans who prefer limited government think cases of police misconduct remain steady and 62 percent believe police only use lethal force when necessary. Many Americans do not see a connection between the size of government and its impact on policing power.
The Reason-Rupe national telephone poll, executed by Princeton Survey Research Associates International, conducted live interviews with 1004 adults on cell phones (503) and landlines (501) October 1-6, 2014. The poll's margin of error is +/-3.8%. Full poll results can be found here. including poll toplines (pdf) and crosstabs (xls).
The post Poll: 47% Say Cases of Excessive Force by the Police Are on the Rise, 45% Say Police Are Too Quick to Use Lethal Force appeared first on Reason.com.
]]>When it comes to the use of lethal force, only 49 percent of Americans are confident the police only use it when necessary. Another 45 percent believe the police are too quick to pull the trigger. Some may find it quite troubling that on such an important issue, only half are confident in police officers' decisions.
There are significant differences in perception across race and ethnicity, as well as income and age. Younger, lower-income, and nonwhite Americans are considerably more likely than older, high-income, and white Americans to perceive injustice in the police force.
Nevertheless, majorities across all remain favorable toward their local law enforcement. However, African-American and Hispanic Americans are more likely than Caucasians to believe police abuse their authority and use force excessively. For instance, only 38 percent of white Americans believe excessive force in police departments is increasing, compared to 73 percent of African-Americans and 67 percent among Hispanics. Only 34 percent of Caucasians believe the police use lethal force unnecessarily, compared to 82 percent of African-Americans and 72 percent of Hispanics.
Differences in income cannot explain these race/ethnic disparities. Majorities of both lower and higher income nonwhite Americans say police abuse is on the rise and are just as likely to believe the police often use lethal force unnecessarily. However, lower income white Americans are more likely than middle class and higher income white Americans to perceive abuse of authority.
There are also regional differences in perception of police abuse. Fifty-four percent of those in urban areas say the police are too quick to use lethal force, compared to 35 percent of those in rural areas. Southerners are also more likely to say abuse is on the rise—52%—compared to only 38 percent of those in the Midwest.
Republicans don't think excessive force is increasing: 54 percent say it hasn't changed much, and fully 70 percent say the police only use lethal force when necessary. Democrats see things differently; 57 percent say cases of excessive force is on the rise and 61 percent say the police are too quick to use lethal force. Independents agree with Democrats' perception that cases of excessive force are on the rise—52 percent. However, 50 percent believe the police only use lethal force when necessary while 40 percent think the police are too quick to use it.
Perhaps ironically, Americans who prefer larger government are the most likely—58 percent—to believe excessive force by the police is on the rise and they are too quick to use lethal force. In contrast, 52 percent of Americans who prefer limited government think cases of police misconduct remain steady and 62 percent believe police only use lethal force when necessary. Many Americans do not see a connection between the size of government and its impact on policing power.
The Reason-Rupe national telephone poll, executed by Princeton Survey Research Associates International, conducted live interviews with 1004 adults on cell phones (503) and landlines (501) October 1-6, 2014. The poll's margin of error is +/-3.8%. Full poll results can be found here. including poll toplines (pdf) and crosstabs (xls).
The post Poll: 47% Say Cases of Excessive Force by the Police Are on the Rise, 45% Say Police Are Too Quick to Use Lethal Force, Significant Perception Differences Across Race and Ethnicity appeared first on Reason.com.
]]>The latest Reason-Rupe poll finds 66 percent of Americans favor airstrikes against Islamic State militants, also known as ISIS, in Iraq and Syria, while 28 percent oppose. However, committing ground troops is far more controversial. A slim majority—52 percent—opposes sending ground troops to combat ISIS, while 43 percent would support it.
If the US does send ground troops, Americans are divided over how many will be necessary. A third say troops will not be necessary, but 34 percent say the US will need to send a large number of troops and 24 percent say a small number.
Perhaps one reason Americans favor airstrikes but oppose sending ground troops is they believe military action against ISIS will last about 2 years. Few also think the previous military intervention in Iraq made America safer. Only 14 percent believe the 2003 Iraq War reduced the threat of terrorism in the US, 83 percent think it failed to make America safer. In fact 38 percent go so far to say the Iraq War made the US less safe.
Support for airstrikes against ISIS extends beyond partisanship, although Independents are most likely to oppose (37%), followed by Democrats (31%) and Republicans are least likely to oppose (20%). The use of military force also divides conservatives from Americans who lean libertarian. Only 11 percent of conservatives oppose the use of airstrikes, compared to 28 percent of libertarians.
Republicans are the only political group in which a majority (57%) supports sending troops to combat ISIS, even though a majority (51%) also expects it would last 4 years or more. In contrast, only 35 percent of independents and 37 percent of Democrats support boots on the ground. Tea party Republicans seem to be driving some of this difference: 59 percent of tea party supporters favor sending troops, compared to 48 percent of Republicans who don't support the tea party.
Not only do Republicans favor sending troops back to Iraq, but a plurality (45%) believe it would be necessary to send a large number of troops, while 25 percent think a small number and 21 percent think it won't be necessary to send troops. In reverse fashion, a plurality of independents and Democrats say troops wouldn't be necessary (38%), and 20 percent say a small number, and 27 percent think a large number would be needed.
Significant differences emerge across age groups, with younger people more averse to military intervention in general. A majority (51%) of 18-29 year olds actually oppose the use of airstrikes, and 39 percent favor. However, majorities of subsequently older age groups support such a military action, including 62 percent of 30-44 year olds and roughly 80 percent of those over 45. Majorities of all age groups oppose sending ground troops, but young Americans are about nearly half as likely as Americans over 55 to say a large number of troops would be necessary (25 to 42 percent respectively).
The Reason-Rupe national telephone poll, executed by Princeton Survey Research Associates International, conducted live interviews with 1004 adults on cell phones (503) and landlines (501) October 1-6, 2014. The poll's margin of error is +/-3.8%. Full poll results can be found here. including poll toplines (pdf) and crosstabs (xls).
The post Poll: 66% Favor Airstrikes Against ISIS, but 52% Oppose US Sending Ground Troops appeared first on Reason.com.
]]>If children are not vaccinated, then a majority—52 percent—of Americans say unvaccinated children should not be allowed to attend public schools. Forty-four percent disagree, saying unvaccinated kids should be allowed to attend public schools.
Democrats (65%) are the most likely political group, followed by Republicans (58%), to say all children must be vaccinated. Independents are the most likely group to say parents should choose, and are evenly divided at 48 percent.
Age also increases the desire to require child vaccinations. For instance, a slim majority (51%) of millennials wants to require vaccinations, compared to 67 percent of Americans over 55.
Americans who prefer smaller government are the most likely (50%) to say unvaccinated children should be allowed to attend public schools. In contrast, among those who favor larger government, 6 in 10 say unvaccinated children should be prohibited from attending public schools.
The Reason-Rupe national telephone poll, executed by Princeton Survey Research Associates International, conducted live interviews with 1004 adults on cell phones (503) and landlines (501) October 1-6, 2014. The poll's margin of error is +/-3.8%. Full poll results can be found here. including poll toplines (pdf) and crosstabs (xls).
The post Poll: 60% Say Childhood Vaccinations Should be Required, 52% Say Unvaccinated Children Should Be Banned From Public Schools appeared first on Reason.com.
]]>